Our Zabbix FileMaker Server Monitoring Session at DevCon 2019
At FileMaker DevCon 2019, Mislav Kos and I presented a session on Server Monitoring with Zabbix. The FileMaker community has good information around this topic but most of it relates to how to install Zabbix.
In this short preview, we fast-forwarded a bit and showcased what the end result looks like. Specifically, we demonstrated the power of Zabbix. It can keep an eye on your FileMaker Server, show you its vitals, and send notifications when things go wrong. However, more importantly, it can also proactively step in and fix important issues.
Restarting the Data API Process with Zabbix
For this article, we will show how Zabbix can restart the Data API process if it stops. You can apply this same logic to the other processes that make up all of FileMaker Server: the server-side scripting engine, the web publishing engine, the ODBC/JDBC process, etc…
When any of these components crash or stop, Zabbix can step in and take corrective action.
How Zabbix Works with FileMaker Server
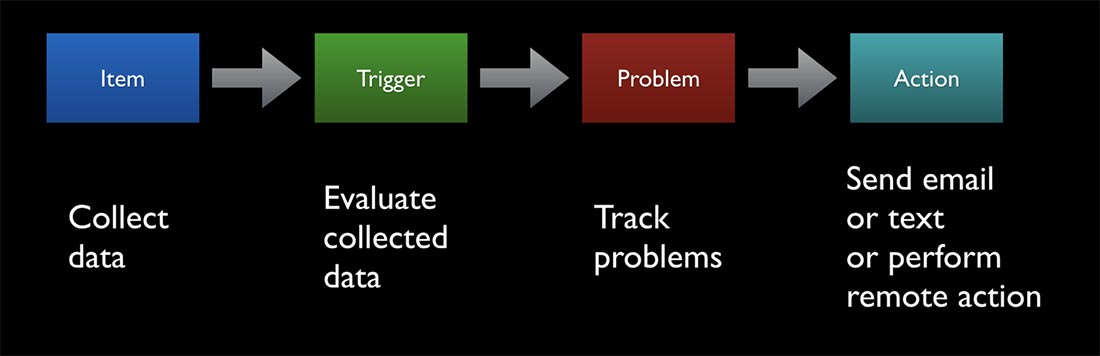
Zabbix works as follows:
- It collects data on items that you have defined. In the Zabbix template released with our DevCon presentation (get them here), we include over 150 relevant items related to FileMaker Server’s health.
- For those items that you deem important, you define a trigger that evaluates the data for a particular item. Examples include: process running or not running, cache hit % below 95%, number of Remote Calls in Progress higher than 10, etc…
- When Zabbix finds that the data for anfdevcon item matches one of your triggers, it raises a problem event. Zabbix automatically tracks these problems and their durations, which you can see in the Zabbix dashboard.
- Additionally, you can have Zabbix take action. Most typically choose to send out a notification by email or SMS. However, Zabbix can also execute a command on the host machine where the problem happens.
FileMaker Server Monitoring with Zabbix
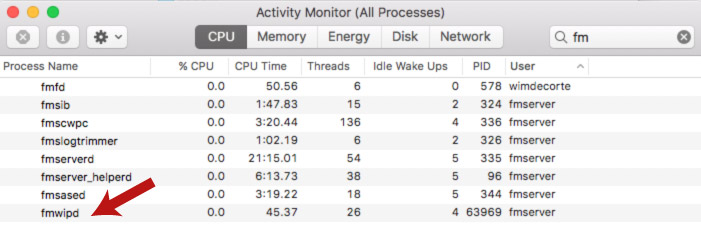
One of the servers we track is a FileMaker Server 17 running on macOS. Using the macOS Activity Monitor we can see the various FileMaker Server processes including “fmwipd,” which is the Data API process.
There are a few different ways that we can track if it stops working; for instance, we could rely on the FileMaker Server event log where an event with ID 701 will be raised when FileMaker Server detects that its Data API has terminated abnormally. Zabbix can certainly (and easily) keep an eye on the event log.
But we will work with the operating system and use the OS tools to track the process. On Windows, we would do this by using the built-in Windows Perfmon and ask for the Thread Count on the process. If it is 0 or there is no data for that counter, then we would know that the process is not running.
But this is macOS, so we will just use the built-in “ps” command to get a list of the running processes and their state.
In our Zabbix template we have an item for just that purpose (note that it filters the output of the ‘ps’ command to just processes owned by ‘fmserver’):

This item will list all of the fms processes every 30 seconds. We have a dependent item that uses this output to look specifically for the ‘fmwipd’ process. For this we make use of Zabbix’s JavaScript pre-processing functionality:

This item will return a simple ‘1’ if the process is running and ‘0’ if it is not.
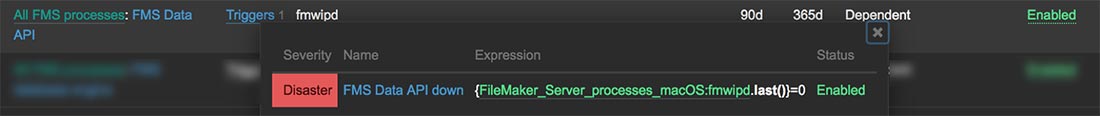
As you can tell from the screenshot, we have a trigger defined for the item to raise a ‘Disaster’ problem when the last value returned for the item is ‘0’. We check this every 30 seconds.
At this point, the problem visibility is limited to the Zabbix dashboard. We need an action to be notified automatically and for Zabbix to take action:
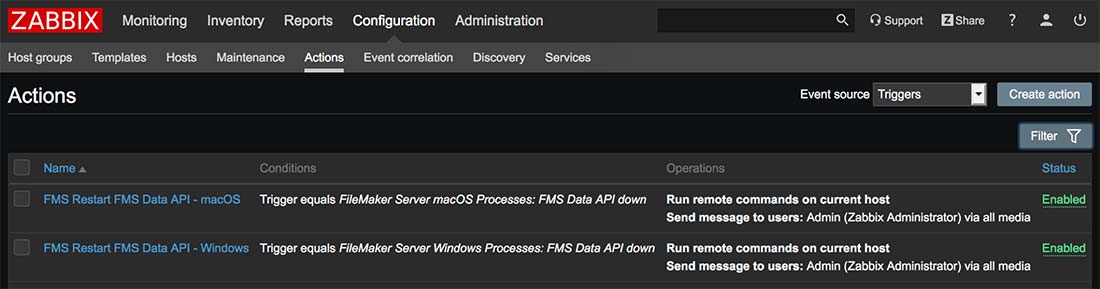
We have configured the action to do two things: email us immediately to make us aware of the problem and also immediately try to restart the Data API through the FileMaker Server admin command line:
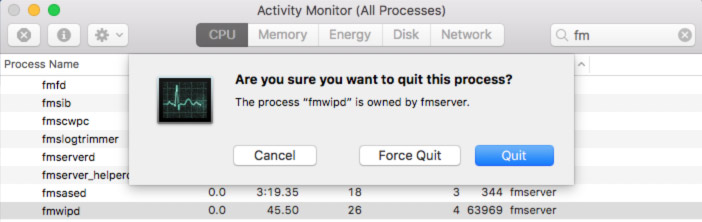
fmsadmin restart fmdapiWhat happens if we simulate a Data API crash? From the macOS activity monitor, we force quit the Data API process:
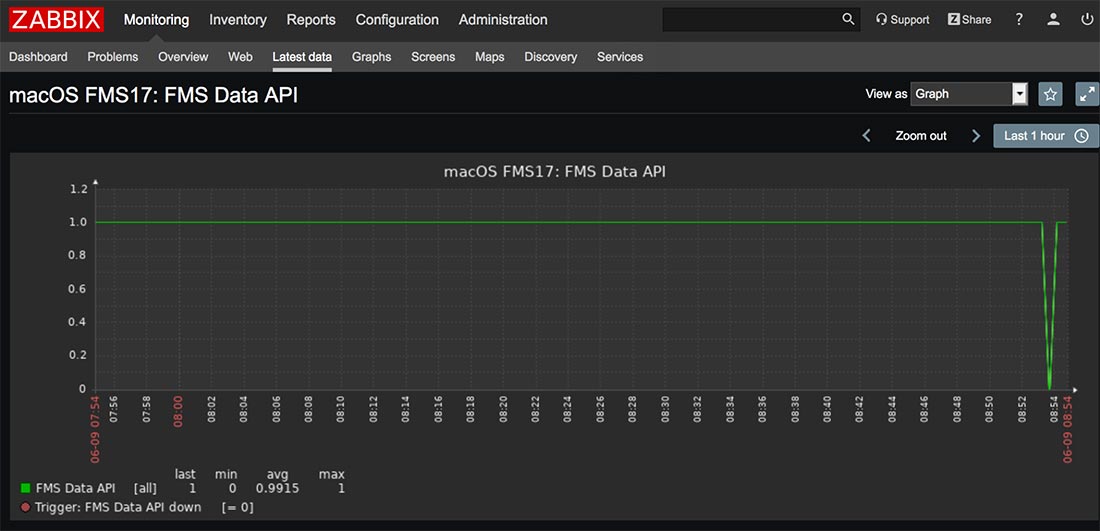
When we turn to Zabbix and look at the data for the Data API item, we see that it was showing ‘1’ (aka ‘running just fine’). It then dipped to ‘0’ (aka ‘not running) and fairly immediately went back to the running state:
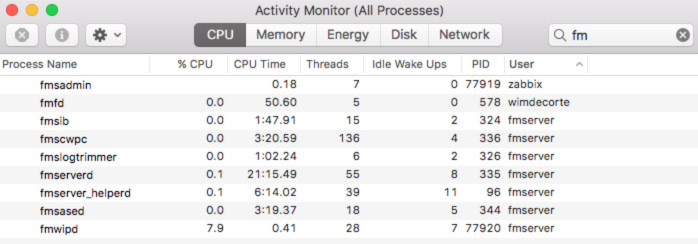
A quick look at our FileMaker Server shows that the process has indeed returned. Note that it has a different process ID (PID) than it had before, an indication that the process has restarted.
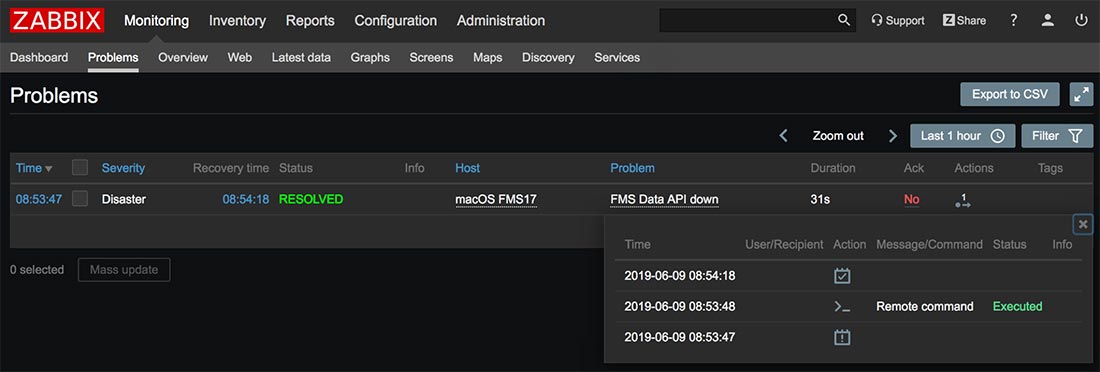
In Zabbix, the problem event was updated to ‘RESOLVED’, and we can see the actions that Zabbix took and how fast it did it:
- At 8:53 and 47 seconds it caught the problem.
- One second later it executed the command.
- 30 seconds later (the next data collection interval for the item), it determined that the process was running and the problem was closed.
Other Zabbix Actions
Zabbix triggers and actions have much more power than what we are showing here, including escalation procedures. However, we hope this shows how Zabbix can give us both monitoring and healing capabilities beyond anything we ever had with just the FileMaker Server Admin Console.
Next Steps with Zabbix FileMaker Server Monitoring
The functionality to allow Zabbix to execute commands on your FileMaker Server is ready for you. We hope this convinces you to consider adding Zabbix to your toolbelt and fortifying your FileMaker Server deployments. Please contact our team if you have any questions!
Looks like a great presentation and I hope there is a large enough room…
Thanks, Mike. Looks like we got one of the biggest rooms in the house 🙂 No pressure…
Yes, and I am presenting in another room at the same time.. imagine how that feels!! 😀