Do you miss the statistics chart?
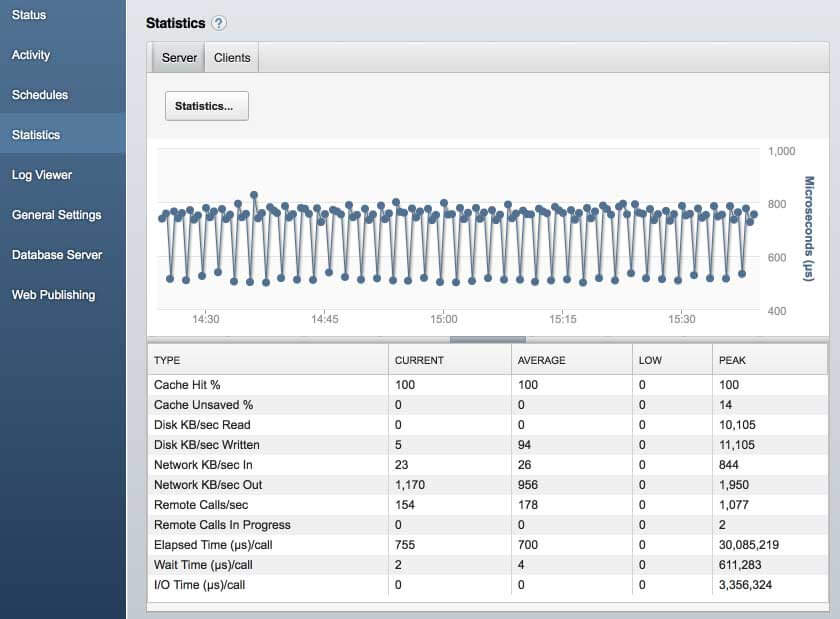
The admin console was rewritten in FileMaker Server 17, and the Statistics section was not carried over to the new version. But when you are dealing with server performance issues, having a live view of the FileMaker Server statistics can be critical.
If your FileMaker Server runs on Windows, you can regain most of this lost functionality using the Performance Monitor tool (“Perfmon”).
Perfmon Set Up
Step 1. Add Performance Monitor snap-in to the Microsoft Management Console.
- Launch the Microsoft Management Console (mmc.exe). One way to do this is to click the Windows Start menu and type “mmc.exe”.
- Go to the File menu, and select Add/Remove Snap-ins.
- Select “Performance Monitor”, select “Add >”, select OK, and select OK again.
Step 2. Set up Performance Monitor with your desired counters.
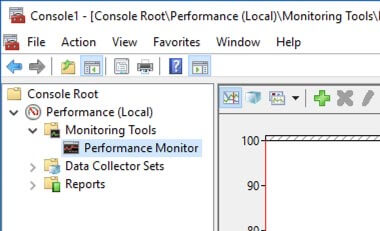
- In the left pane of the Console window, go to Performance (Local) > Monitoring Tools > Performance Monitor.
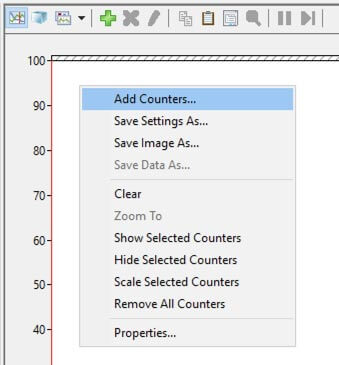
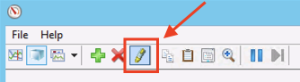
- Right-click in the blank space of the pane on the right side and select “Add Counters”.
- Add your desired counters.
The Performance Monitor tool gives you access to all of the stats that were available in the Statistics section of the FileMaker Server 16 admin console and to a whole new set of Windows OS stats (called “counters”). If you’re not sure which ones to add, try these:- FileMaker Server 16 > FileMaker Clients
- FileMaker Server 16 > Remote Calls In Progress
- FileMaker Server 16 > Remote Calls/sec
- FileMaker Server 16 > Elapsed Time/call
- FileMaker Server 16 > Wait Time/call
- Processor > % Processor Time > _Total
- Process > % Processor Time > fmserver — The fmserver process is the main one, but also pay attention to the other ones starting with “fm”, especially fmsase (server script engine).
To see which counters FileMaker recommends tracking, see the “FileMaker Server for Windows Performance Monitoring” article.
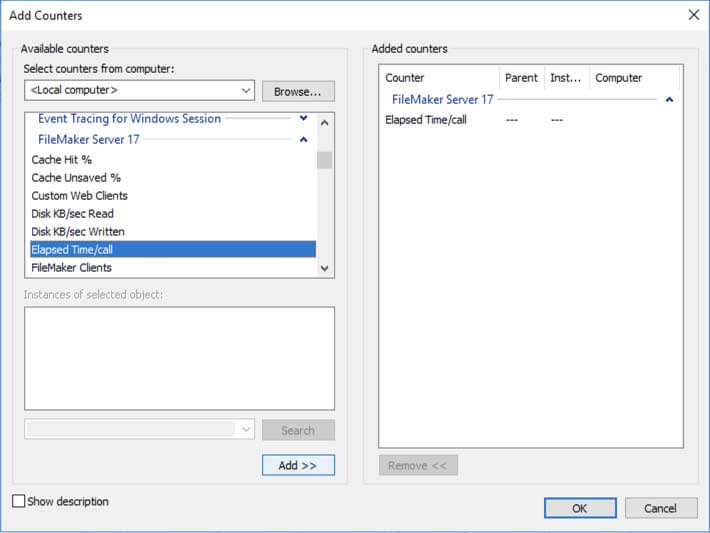
As an example of how to add a counter, to add the “FileMaker Server 17 > Elapsed Time/call” counter, find “FileMaker Server 17” in the list, click the down arrow to show the counters for FileMaker Server 17, select “Elapsed Time/call”, and click Add.
- Fine tune how the counters are displayed.
Make sure that the “highlight” option is enabled. This will make it easier to see the currently-selected counter.
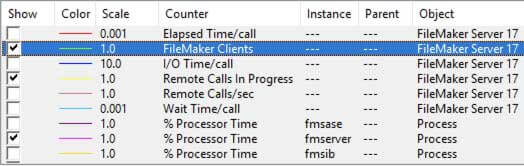
Set up the counters so that the ones you check most frequently are shown on the chart and the others are hidden (unchecked in the “Show” column).
Pay attention to the scale. When the counters were added, the tool guessed at what the scale should be for each counter, but you may prefer a different scale setting. Here’s how the scale setting works: If the % Processor Time chart shows that the value is mostly between 10 and 30, but the scale is set to 10, then the value is actually between 1 and 3. To change the scale, double-click on it or right-click and select Properties (or press control-Q).
Here’s how I set my counters up the last time I did this:
Step 3. Save Console configuration
- Go to the File menu and select “Save As…”
- Save to a folder that is accessible to everyone who will need access to this.
- For instance, I saved mine here: C:PerfLogsFMS 17 Perfmon Live View.msc
- Close the Microsoft Management Console.
Accessing the “Live” View
Double-click on the saved file to open the perfmon console. It will retain your last settings, including selected counters and their scale settings.

Perfmon Constraints, Limitations, and other Notes
Last minute’s data only
This “live view” will only show the last minute’s worth of data. To see the previous history, you can set up Perfmon to save the data. See the “FileMaker Server for Windows Performance Monitoring” article for instructions on how to do this.
Admin rights required
You will need to log into the server with an admin account to access Perfmon.
Concurrent views
Because accessing Perfmon requires you to connect to the server via RDP, having multiple people viewing Perfmon at the same time will require the server to maintain multiple Windows RDP sessions. It’s best to avoid this, especially during times when the server is experiencing performance issues. So coordinate amongst your team to pick just one person who will have the Perfmon view open during times like that.
Interpreting “% Processor Time”
The percent value has a different meaning depending on which counter (processor or process) you are looking at:
- For the “Processor” counter:
- 100% means that all cores are completely utilized. If your server has 32 logical processors, then 3.1% (1 divided by 32) would be the equivalent of one fully-utilized processor.
- For the “Process” counter:
- 100% means that the process being monitored (for example, the “fmserver” process) is fully utilizing the equivalent of one logical processor (i.e. one core).
- 200% means that the process is utilizing the equivalent of two logical processors, etc.
If you have any questions or need help with your FileMaker solution, please contact our team.