The new Chart Tool of FileMaker Pro 11 is very powerful; it allows for the charting of a variety of data sources. One of the data types supported is “Current Found Set” and when the option “Show data points for groups of records when sorted” is selected, the chart can display summary field values. It’s basically the graphical equivalent of a summary report that only includes sub-summary parts without a body part.
When programming a chart using summary data it is important to keep in mind that the resulting chart varies with the current sort. If the user were to change the sort, the values displayed will also change. This dependency requires great care to ensure the chart title and labels stay in synch with the data represented. Because chart data can be specified via the calculation engine, the chart title, labels, and even the data itself can be dynamic and thus can always stay in sync with the sort.
The demonstration parses the snapshot’s XML to determine the current sort and calculate the chart’s content.
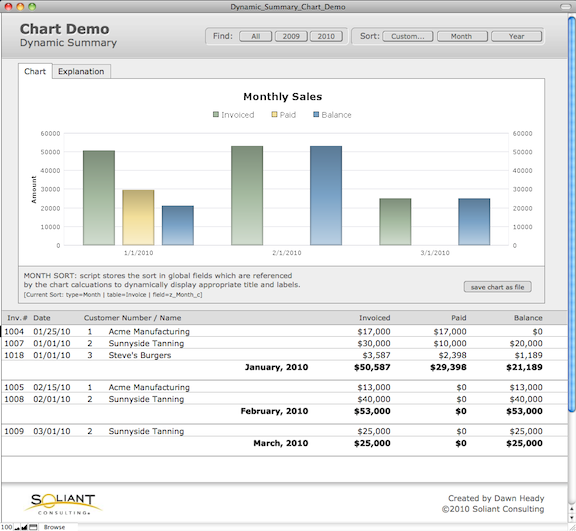
In the demonstration file Dynamic_Summary_Chart_Demo.fp7 there is only one chart, but it dynamically updates based on the users found set and sort. The chart has several important features:
- When the user selects the sort button “Year” or “Month”, a script performs a hard-coded sort of the current found data and stores three bits of information about the sort in global fields: sort type, sort table, and sort field. The chart’s calculations reference these global fields when determining what title, labels, and data to display.
- When the found set is changed, either by clicking one of the on-screen find buttons or by performing the menu command “View > Find Mode”, the data is re-sorted and the chart refreshed.
- When the data is unsorted, the chart calculates to display no bars and the Chart Title will display a message encouraging the user to sort the data.
- By making use of another new feature of FileMaker 11, Save Records As Snapshot Link, the user can even perform a manual sort of their own choosing and the script will parse the snapshot’s XML to determine the user’s sort table and sort field. Once the script populates the global fields of sort information, the chart’s calculations will dynamically update.
- Because there is no ScriptTrigger that executes every time the sort is changed, the solution makes use of Custom Menus so that Sort and Find Mode commands are fully supported.
Get the Demo File
The demonstration file is unlocked and contains a video to further describe its methods.
I have just stumbled across this post. Thank you very much for a terrific technique and the extremely clear explanation. It addresses precisely a problem I have been struggling with. I look forward to getting fully to grips with it and implementing it in my own solutions.
I am what you might call an intermediate Filemaker developer and the idea of snapshot parsing certainly hadn’t occurred to me.
That’s a subtle way of tihkning about it.
This was clear, very elegant and surprisingly powerful. Thank you for sharing the methodology, database file and movie – you have really increased my understanding of this topic!
Thank you for the Demo and Video is was very useful as I am a Filemaker Beginner.