The default dashboard that you get with a new Zabbix instance is not exactly optimized for monitoring a FileMaker server (see Figure 1). It focuses on displaying Problems, in two different ways, adds an analog clock showing your own current time, not the server’s time (why would I need this? And why analog?), a placeholder for Favorite maps (not even sure what these are), Favorite graphs, and system information for the Zabbix server.
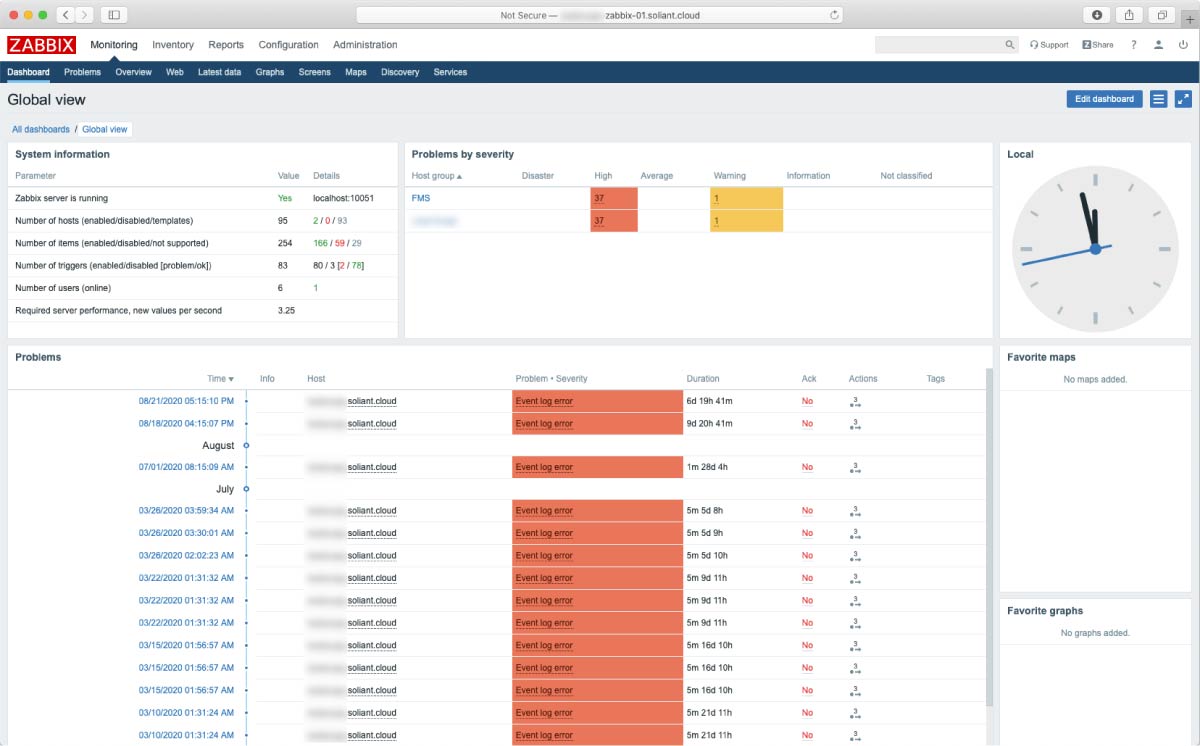
This is all well and good if you have a Problem trigger set up for everything you might want to monitor, but I found this information to be less than useful when receiving a call from a client complaining of slowness in their FileMaker system.
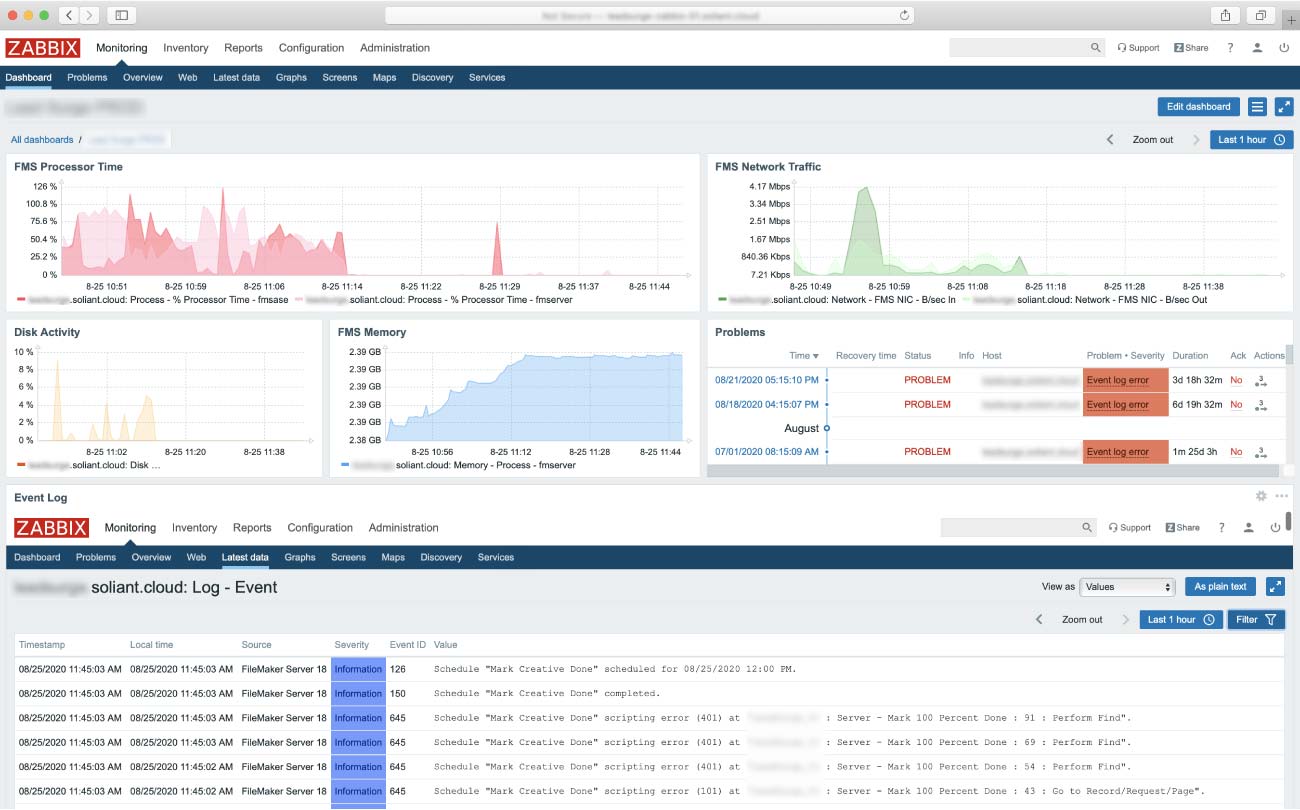
When troubleshooting server issues, there are a few things I want to know…mainly, which of the traditional bottlenecks is causing the issue? Being a visually oriented problem solver, I prefer to see pictures. I also need easy access to the Event Log. Provided your Zabbix instance is collecting the necessary info, you can set up graphs to display stats such as Processor time (aka, CPU load), Network Traffic, Disk Activity, and Memory usage.
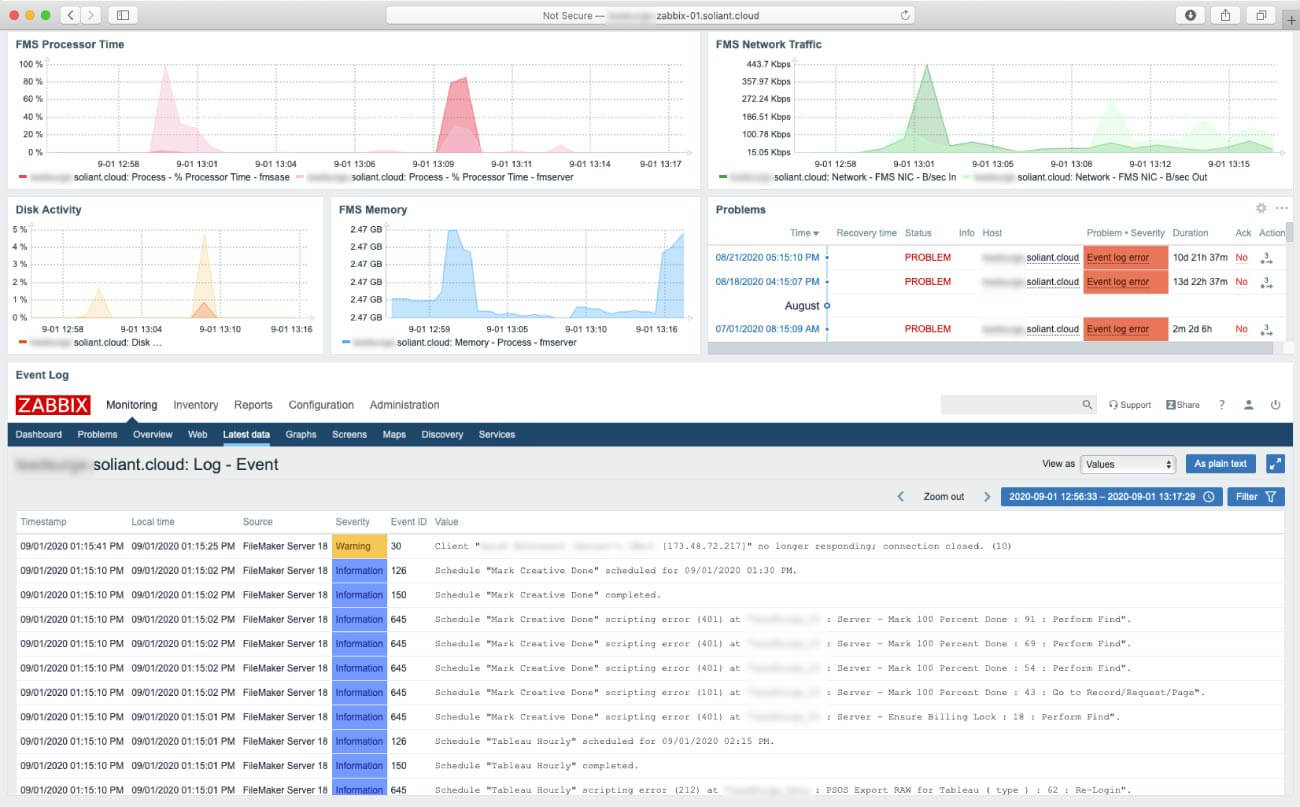
Yes, you can navigate within Zabbix to the Monitoring > Graphs area, then select the graph you need, but they are singular here; you cannot overlay multiple graphs. However, you can create graph overlays on a dashboard widget. I also like to see everything in one place, so I customized the dashboard (see Figure 2) to show the pertinent graphs on the top, a list of problems, and a view of the Event Log on the bottom.
How to Customize Your Dashboard
If you have sufficient privileges on the Zabbix server, start by either editing the Global view dashboard or creating a new dashboard from the All dashboards list. You will have a “Create dashboard” button on the Monitoring > Dashboard > All Dashboards screen or an “Edit dashboard” button on the default dashboard.
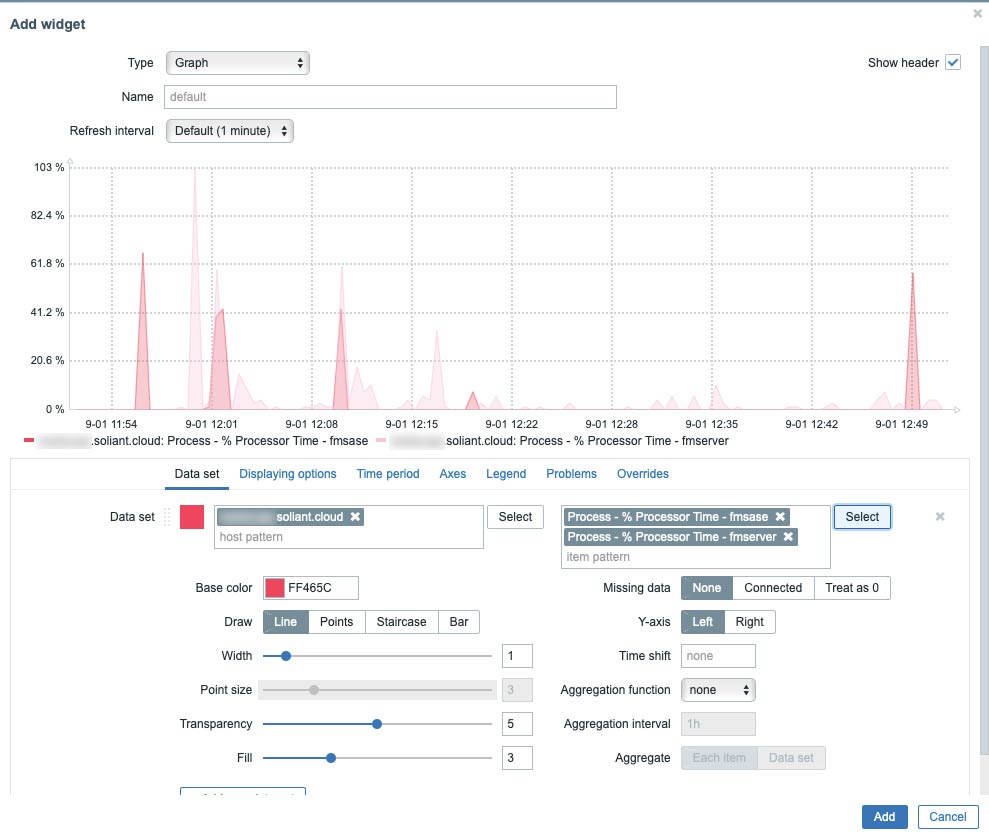
Give the dashboard a name and click Apply. Click anywhere on the blank dashboard to bring up the Add Widget dialog (see Figure 3). You can select the type of widget and its associated options. If you did not use the Soliant Zabbix template to set up your Zabbix monitoring, your items may have different names than what I outline below.
Let’s start by creating the graphs. Click Add widget and set the type to Graph. The only things we really need to input are “Data set” (your FileMaker Server) and “item pattern” (the counters to display on the graph). It is also helpful to select different colors, so your graphs aren’t all red.
Once you click Apply to create the graph, you’ll want to resize it so you can fit more widgets on the screen.
These are the counters I used for each graph:
Processor:
- Process – % Processor Time – fmsase
- Process – % Processor Time – fmserver
Network:
- Network – FMS NIC – B/sec In
- Network – FMS NIC – B sec Out
Disk Activity:
- Disk Activity – {$FMS_DATABASE_VOLUME} – % Write Time
Memory:
- Memory – Process – fmserver
Next, let’s add the Problems list. Make a new widget, and set the type to Problems, set your Host Group and Host, then resize it to fit. Save the dashboard at this point since we’ll need to navigate away for the next part.
Finally, I like to have ready access to the FileMaker Event Log. There are different ways to display this, but I found that using the URL widget gives me the most control and is capable of showing more lines of the log. This widget is a bit fussy, so just repeat the steps if it doesn’t display anything the first time.
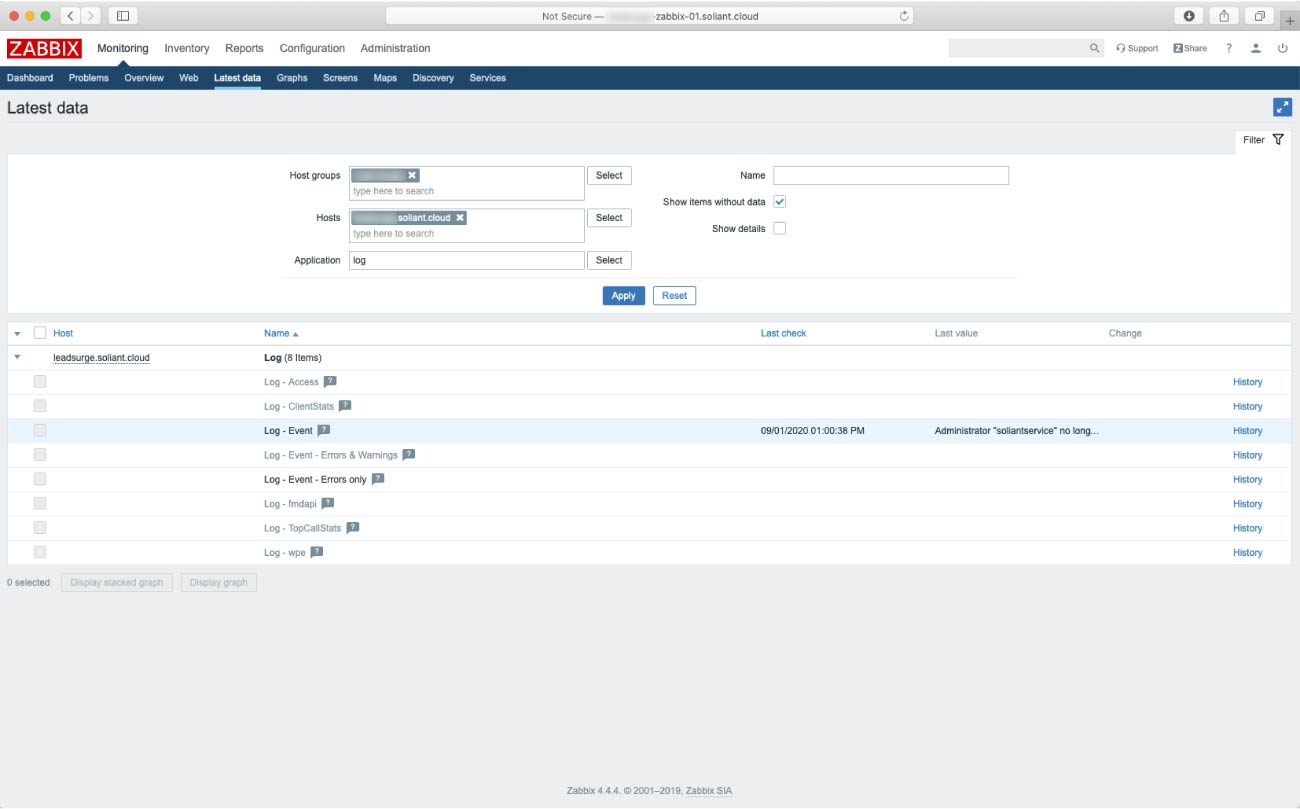
Navigate to Monitoring > Latest data. Make sure Host groups and Hosts are set, filter the Application field to “log,” and click Apply. You should see the last value retrieved displayed to the right of Log – Event. If so, click the History link on the far right. This should give you a filterable display of the FileMaker Server Event Log.
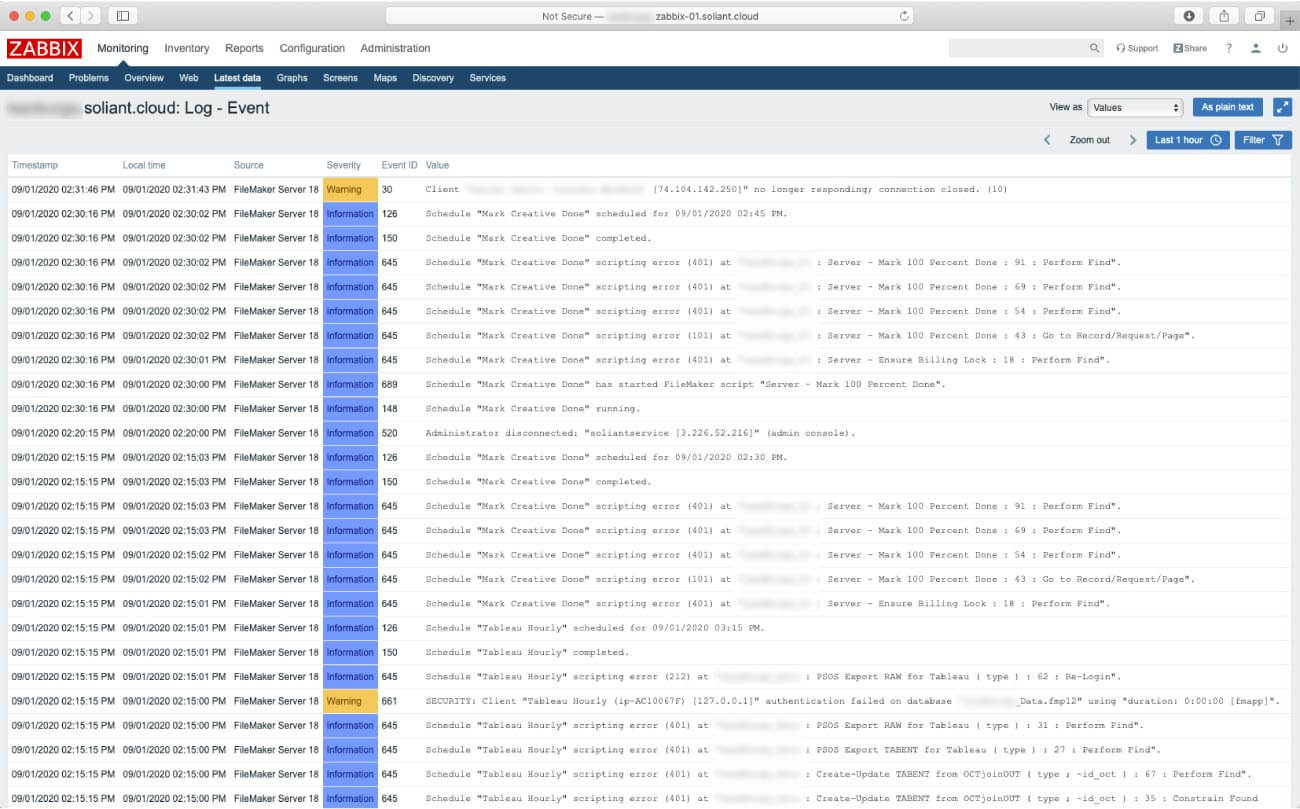
Copy the URL from your browser’s location and navigate back to your dashboard. Click Edit dashboard again and add a new widget, setting the type to URL. Paste in the address you copied in the URL field, then click Apply. This works a bit like a webviewer in FileMaker – you’ll see all of the navigation chrome, which you can hide by clicking the view toggle (box with arrows in the top right corner of the widget). Be aware that this may change the view toggle of your whole Zabbix view – it’s a little wonky.
Bring on the Troubleshooting!
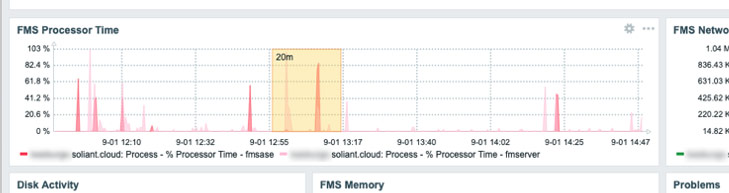
The combination of graph widgets and a filterable Event Log view is a powerful troubleshooting tool. If you notice that the FMS Processor Time graph shows a prolonged spike, you can narrow down the graph view to the timeframe of the spike (just click and drag your cursor over the area), grab the start and end timestamps from there, and paste them into the start and end timestamps of your Event Log widget to see what the server was logging during the time that the CPU was spiking.
There are many more customizations you can make to help you monitor your server(s) more efficiently – these are just the ones that I find to be the most useful. Go ahead and experiment! These widgets are just displaying data, so you aren’t going to break anything. If you need help, feel free to contact our team.
Are there a more updated versions of the templates?
Hi Joe,
No, not yet. We were hoping that by open-sourcing this there would be more community contribution, but that has not materialized. We’ll update the templates at some point based on the new features.
Thanks for the reply. I am having some issues with the templates in my MacOS dev environment running 22. I’ll keep digging around and I’ll let you know what I find.