This post is one in a series of guides that walk you through installing, configuring, and using Zabbix to monitor your FileMaker servers:
- Part 1: Getting Started with Zabbix (this post)
- Part 2: Installing Zabbix as an Appliance
- Part 3: Installing Zabbix from Scratch
- Part 4: Installing Zabbix Agent
- Part 5: Zabbix Configuration
- Part 6: Using Zabbix
- Part 7: Maintaining Your Zabbix Server and Agents
Why Zabbix?
We believe that monitoring your FileMaker Server is crucial for a stable, performant, and secure deployment of your FileMaker app.
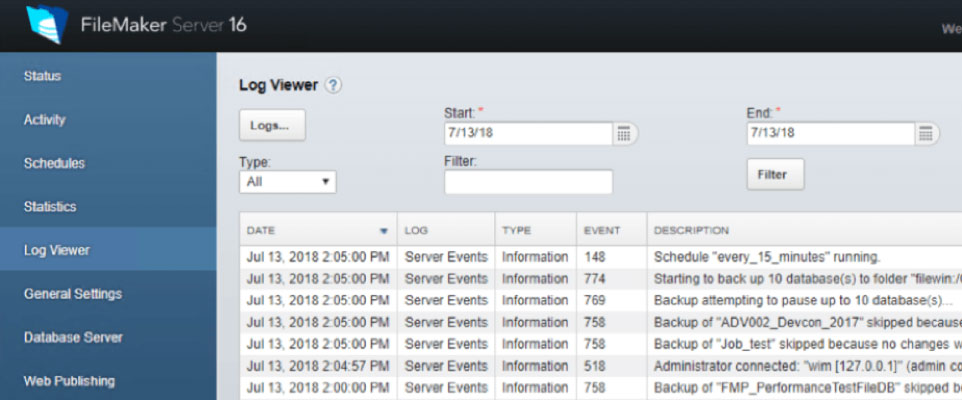
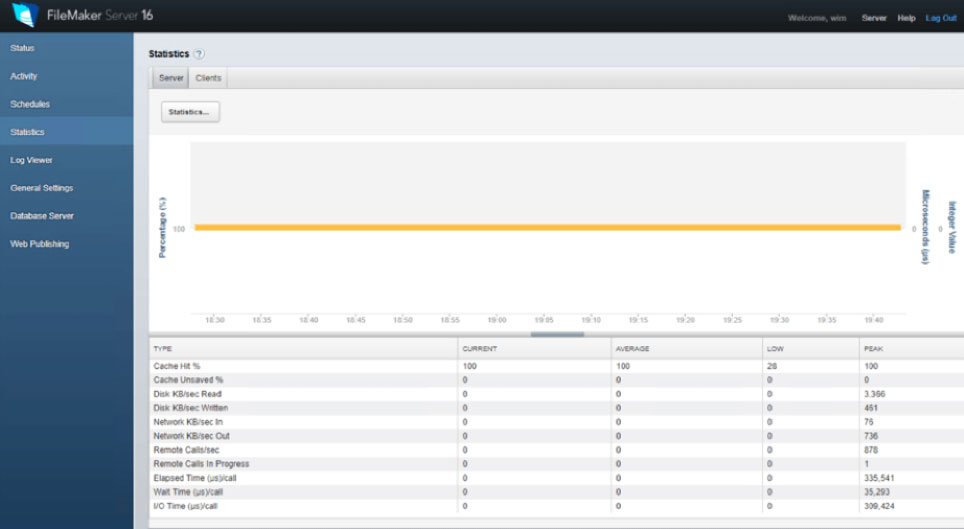
The FileMaker Server admin console overhaul with version 17 removed the live statistics viewer and live event log viewer.
And that, at first, seems like a giant step backward. But it isn’t really.
In my 2018 DevCon session dedicated to a review of the new Admin Console and the updated Command Line and new Admin API, I had mentioned some of the available tools to monitor your server, with Zabbix as one of them. All of the tools that I had listed pretty much deliver the same functionality. However, here at Soliant Consulting, we settled on Zabbix for a variety of reasons that you can see listed in the slide deck for our 2019 DevCon presentation.
Those tools, Zabbix chief among them, give us the ability to do much more than we could ever do with the old-style FileMaker Server Admin Console. With Zabbix, you have very fine-grained control over the things you want to monitor, and just as important: on the actions, you want to have taken if something is off. You can have Zabbix automatically restart a process such as the server’s scripting engine, the Data API, or web publishing. You can create intricate escalation rules if problems do not get resolved quickly. And you can build your own dashboards to see just the things that you want to focus on the things that are important to you.
So how do you get started?
Let’s tackle the elephant in the room: you’ll need a Linux server. Zabbix Server runs only on Linux.
We may lose you here but stick around for a bit longer. The Linux requirement should not be a stumbling block for anyone.
We fully recognize that not everyone wants to have to go through multiple steps of what seem like complex and incomprehensible command line wizardry just to get to the starting line.
Here are your three options to set up a Zabbix Server as we see them:
Appliance
If you do not feel comfortable working in Linux but still want to explore what Zabbix has to offer, we suggest downloading one of the pre-built appliances.
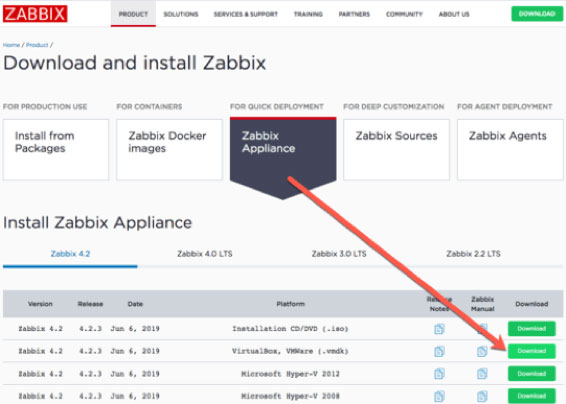
Such an appliance is a virtual machine with Linux already installed, and Zabbix installed on top of that. It’s very much plug-and-play and ready to go. Import the Zabbix template that we put together for our DevCon presentation, and install the Zabbix agent on your FileMaker Server.
Follow along with the “2a – Zabbix as an Appliance” guide to easily create a working Zabbix installation. We do note that Zabbix mentions on the appliance download page intended for testing rather than production. However, we believe that is production-ready to monitor FileMaker Servers.
Note that if you are familiar with Docker, you can also deploy Zabbix that way.
Do-it-yourself
If you do feel comfortable with Linux, or you want to expand your skillset, then there are some excellent resources for you to follow along with:
- FileMaker Inc. has a white paper that describes how to install Zabbix. Those instructions are for Zabbix 3.4. The current version is 4.2, but the instructions are still valid.
- We have our own guide (2b – Zabbix Full Installation) in which we have captured many of our lessons learned. It is more detailed than the FileMaker Inc. white paper.
Commercial Product
If you want proper server monitoring without the learning curve of a new tool and are willing to forgo the ability to tweak everything yourself and potentially expand the monitoring to other aspects of your infrastructure then consider using one of the commercial products like the Nutshell Console. This product is built specifically to monitor just a FileMaker Server.
But in the Old Console, You Didn’t Have to Learn Anything!?
That is true. But what we had in the old Admin Console was also somewhat limited. Using a tool that was designed to this task well is far superior to what we had before.
As with most things, the unfamiliarity can be a little off-putting, and that is what we try to counter with these guides. There is a learning curve to using Zabbix, as there is with any decent monitoring tool, but going through the learning curve is very worthwhile.
What Versions of FileMaker Server Apply?
Monitoring a FileMaker Server with Zabbix works with all versions of FileMaker Server. There are a few items dependent on the Admin API, but the vast majority of items we monitor on our FileMaker Servers are generic and work on all versions.
Official Documentation
Please refer to the Zabbix documentation to dive deeper on these topics. This documentation is excellent and thorough.
Download this Post as a PDF
Work with Zabbix FileMaker Server Experts
Would you like to set up Zabbix for your FileMaker solution but would like guidance? Our team has worked extensively with Zabbix, and we’re happy to help. Contact our team to get started.