In my DevCon 2017 session on Web Viewer Integrations, I very briefly showed an extension of the concept presented in the form of a pivot table. I had roughly 20 seconds to show it, and so I provided a quick overview of some of its features. In the waning seconds of the hour, I promised some follow up, and here it is.
Pivot table reporting is somewhat of the holy grail in FileMaker development. A quick search in the FileMaker Community discussion board revealed over 20 posts about this very topic. Unfortunately, this kind of reporting is difficult to do in native FileMaker. It requires some combination of portals or repeating fields, ExecuteSQL, and maybe some calc fields. A pivot table report is tough to build, which is why many of my clients ask for exports. Then they use the data within Excel to build a pivot table externally.
That’s too many steps just to see your data. We want you to stay in FileMaker, so we need to provide for them a great way to use a pivot table.
Today I’m sharing how to create a pivot table through a PivotTable.js integration and how to leverage its best features.
Pivot Table Report Features
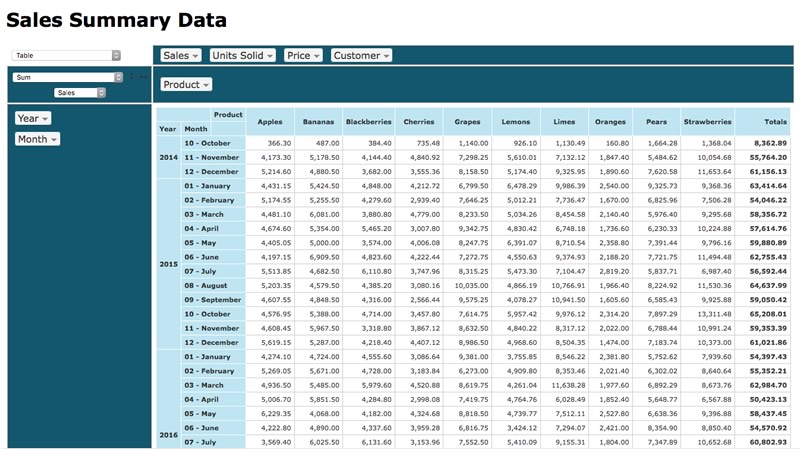
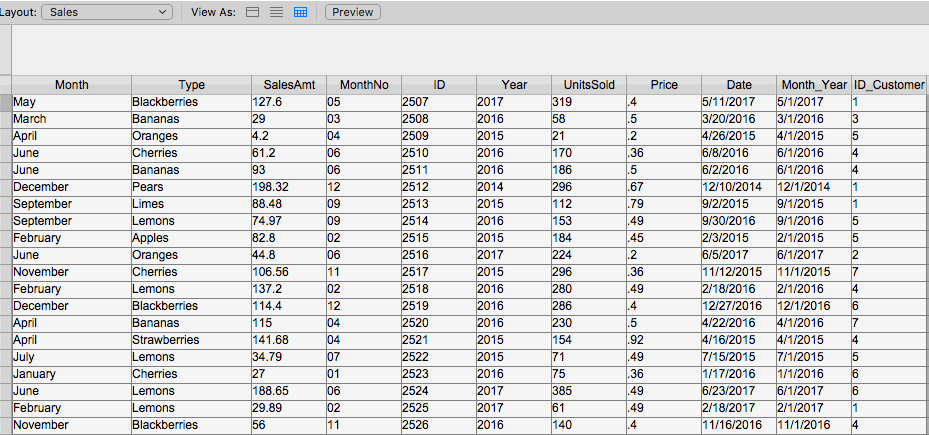
Let’s start by showing the capabilities of this integration. The above pivot table takes data from a sales table and summarizes it from many different perspectives. More than 17,500 records show a date, unit price, quantity sold, and total price of products. Once you load the data into the integration via a script, you can view the data viewed from many different angles and view it very quickly. There’s no reloading of the data from FileMaker. The library does all the work on its own.
NOTE: This is the beauty of many JavaScript integrations. Once loaded, the data calculations and rendering moves quickly. In a hosted version of this file, it takes FileMaker less than 2 seconds to load the pivot table into the web viewer. From there, changing the perspective, adding or removing attributes, and seeing the updated perspective is almost instantaneous. The slowest part of this process is gathering the data.
Library features include the following:
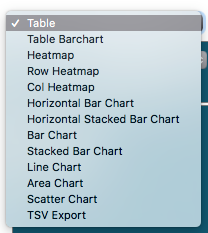
- 13 different renders of the data, including the basic summary table you see above, heat maps, C3 charts, and even an export view that allows the user to (if they must) export the data to Excel using comma-separated values. See Figure 2 below.
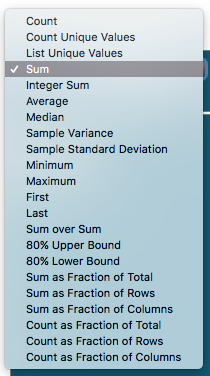
- 22 ways to summarize the data: Sum, maximum, minimum, average, Sum as Fraction Rows, etc. See Figure 3 below.
- The ability to drag and drop an attribute to either the x or y axis. Multiple attributes can be used, as you see in the first picture.
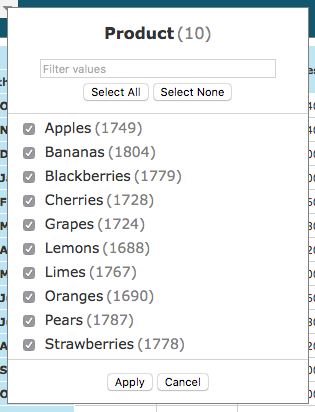
- Filtering functionality for each attribute. For example, I can click on “Type” and remove one or more products from the summarization. See Figure 4 below.
- Sorting capabilities. You can sort both columns and rows in default order or by total descending or ascending.
Pivot Table Report Setup
Overall the setup is not complex in any way. I’ve worked out what is needed and have tweaked the function to make it fit a normal need in FileMaker. Here are your requirements:
1. A summary table from which to gather the data
2. The HTML and CSS code
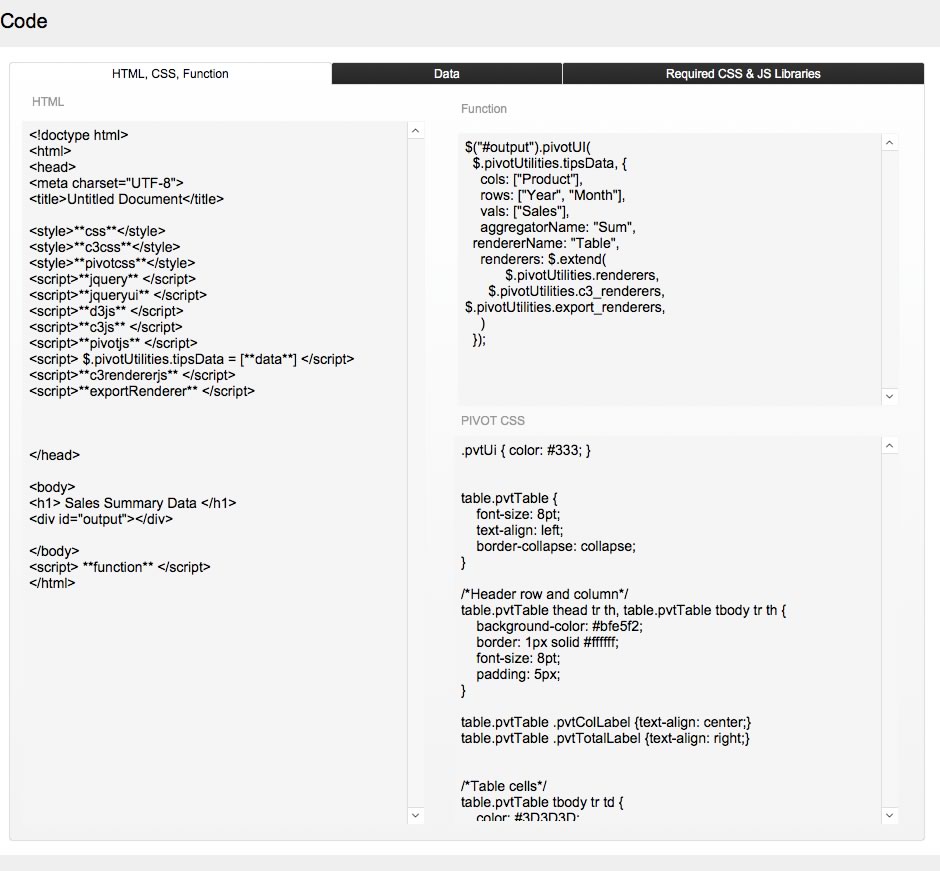
3. The data gathered in a certain format and a script that gathers the data in this format
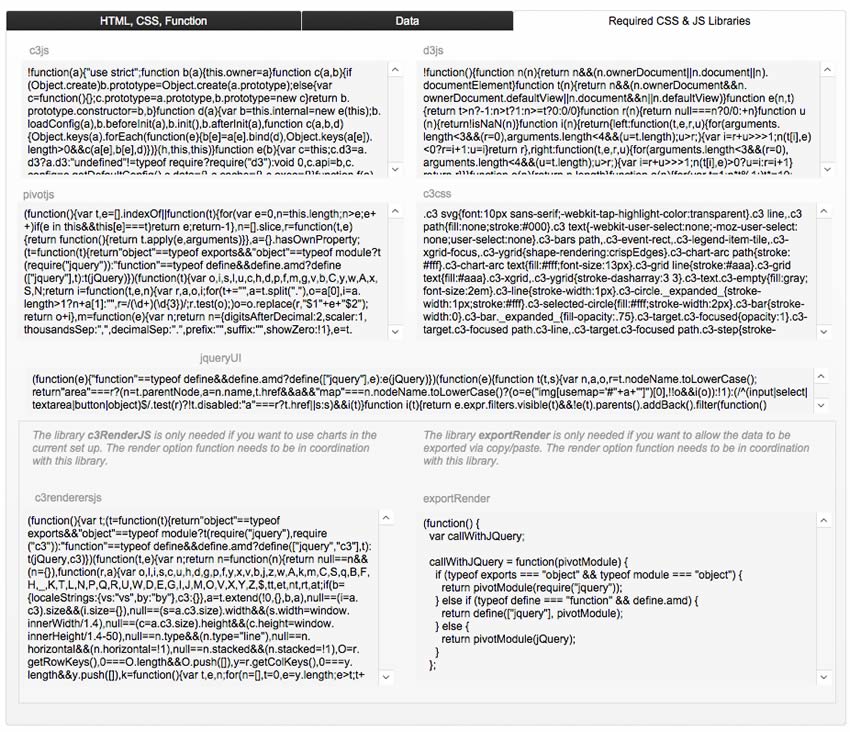
4. The other required libraries
As with my Web Viewer Integrations library, you can easily import these fields into your own custom app.
Gathering Data
You must gather and set the data for the table to properly summarize it. Follow these steps for a successful setup:
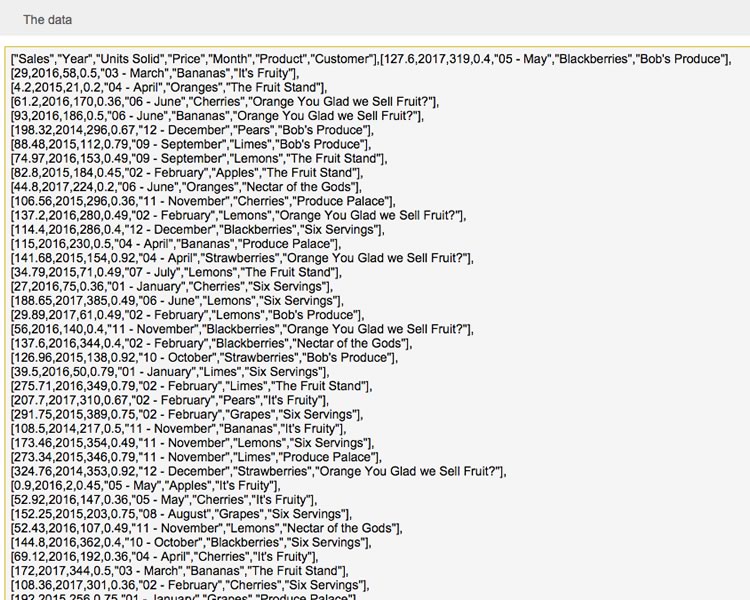
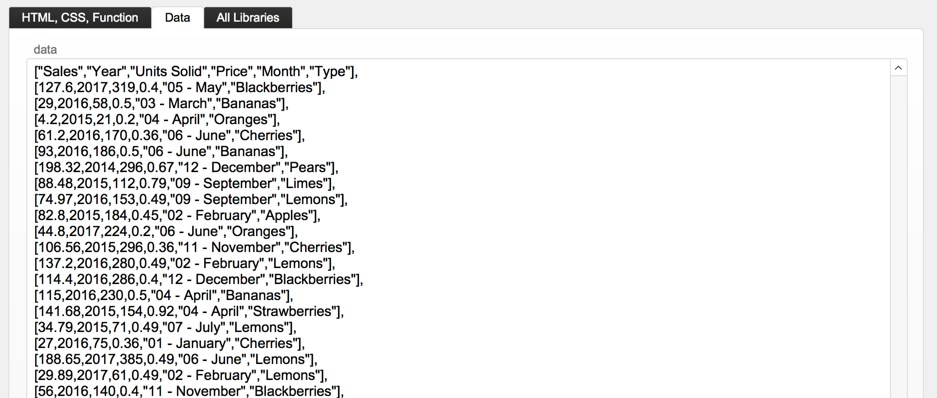
- Gather all data as individual arrays, with each array separated by a comma.
- Make the first row the header, i.e. the name of the attributes displayed in the chart and moved around.
- Of course, the order of the data gathered matters. Gather your data in the same order as the header. In the example above, the “Sales” header is first, and the sales data comes first in each array.
- Using FileMaker 16’s new JSONSetElement() function, you can set a field to gather the data.
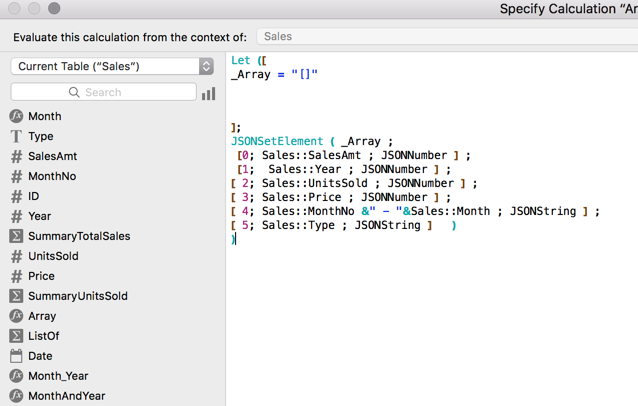
- Then use the ListOf summary field type to gather all the data during a script. Notice this script first sets the header row and then adds to that variable the LIstOf data.
Of course, you can gather the data gathered in a multitude of ways. It all depends on the circumstances you have for the given custom app.
Final Tweaks
As with other Web Viewer Integrations, you can edit the style of the pivot table, but everything else is ready for you to use. All you have to do is provide the data, and you have a complete, multi-function pivot table.
I’ve made some other tweaks to this to make it easier to use and more useful for you.
- I added another field to the pivot table to ensure you could easily add any field. In this demo, you’ll see Customers. You would need to collect the data again to use this. In this case, the data is collected with a new script called “Gather Data_Loop” and it does that, setting each array needed using JSONSetElement(). The script gathers data from the sales table and from the related table of Customers.
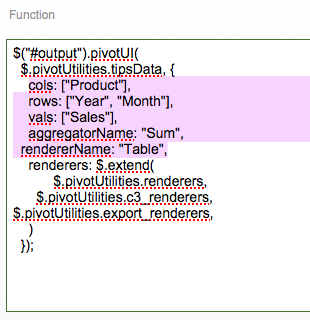
- I set up some defaults to the chart. My chart, in the function, is set to render the table showing the sum of Type in the column and Year and Month in the rows, as shown in Figure 11.
How to Set This Up in Your Custom App
It is very simple to push this to your custom app. Just follow these four steps:
- Import these fields into your custom app into a new table. You’ll be bringing over my data, so you may want to erase that data once you have the fields imported.
- Copy the HTML_Calc calculation field from this demo to a new field in this table.
- Write a script to gather the data. See mine as a template. Set the data into the field.
- Accept or change the defaults that are in this library.
That’s it. You now have a fully-functioning, multi-use pivot table!
PivotTable.js in FileMaker Demo
I’ve done enough research to know that just about anything that you want to do in FileMaker that isn’t already possible can be accomplished by using a web viewer and a JavaScript integration. Check this one out and see if it works for you.
If you have any questions, please reach out to our Carafe team.
Hi
and thank you for your continuous contribution of excellent files.
This one though does not display anything in webviewer when run on Windows 10 pro with Filemaker 16.02,
Web viewer runs internet explorer 11 as suggested in this article:
https://community.filemaker.com/thread/156255
Hi there. Thanks for the feedback.
You’re right, these do not run well in Windows using IE. It is, I believe, due to IE on Windows disabling jQuery to run. I confess I don’t fully know the solution, but am motivated to find a solution. I think it has to do with IE’s disabling of ActiveX controls, which jQuery still has, . . . . It gives me a big headache.
Anyway, thanks for reminding me and folks about that. I’ll figure out how the source code, IE or the integrations, need to change.
Hello, Thanks for making this demo.
When I open the file on my Mac using FileMaker 16, I only get “Sales Summary Data” on the web viewer.
Hi Carlos.
Sorry about the delay in getting back to you. I was in jury duty all week.
It looks like a stray comma is in the function field, causing the error you see.
Go to the Code layout and remove the last comma after “$.pivotUtilities.export_renderers” in the function field. That should clear it up. I’ll post an update on Monday.
Hello Jeremy,
very nice implementation of a pivot table much apprecioate the fact that you made it public.In mac as you know it works great but in windows it does nothing.Is there a workaround ori we call it a mac specific feauture?
Thank you so much for this demo, Jeremy, it’s really mouth watering. I know our clients gonna love their pivot table!
Oh, one question if I may: I can’t seem to find the place in that very condensed code where I could alter the appearance of the main table that sorrounds the pivot table itself. I would like to reduce the size of these elements. Can you point me in the right direction here?
Dear Jeremy,
wow, this is a really powerful example and one that really makes a difference. I often export data to open it in Excel and prepare it for Pivot-Tables. But to have it in the system is a huge step forward. Thank you very much for sharing!
Kind regards, Martin
Hi, very good example. Have you already thought of combing it with a virtual list table? Just to make it multi-user-viable and also multi-purpose-robust…
I just discovered this and it looks great. Thank you! Any known issues with running this from a file on FileMaker Server 14 using FileMaker 15 client? I have been unable to get the pivot table to render. If I go to “WhatIsMyBrowser” from the Web Viewer, I get Internet Explorer 11 on Windows 7 [Internet Explorer 9 Compatibility View]. Could that be the problem?
Thanks a lot Jeremy!
This example works on webdirect? I’m trying but I was not successful.
Thanks for this Jeremy! This will save me time from exporting data into excel.
I am having one issue when I incorporate everything into my solution. The PivotTable is giving me an error…”An error occurred rendering the PivotTable UI.”
Have I missed something?
Hi Chuck,
The best way to get instant help on this is to ask the question on the FileMaker forum: community.filemaker.com. Plenty of people that that can jump in and look at where you are with implementing something like this.
Best regards,
Wim
Does this display on Webdirect? Any known issues using this on web direct? FM Server 17/18
Hi Sam,
While I haven’t tested this particular lib in webdirect, I would not hesitate to try as it is and see if it works. If there are any issues, you might refer to another post regarding displaying complex html in web viewers here: https://www.soliantconsulting.com/blog/display-complex-web-viewers-in-webdirect/
This is an absolutely brilliant tool. Thank you so much for sharing. Can I ask – have you been able to get data specific sorters and aggregators to work as in the example at https://pivottable.js.org/examples/montreal_2014.html I have tried several modifications to the function call but just can’t seem to get this to go (best alternative is to import ordering numbers with the data headers in the creation statement. Thank you
You might check a more up to date example here: https://carafe.fm/bundle/widget-studio-pivot-table-1-0-1/
Cheers. Thanks Mike
Hello! You are a saint! Thank you so much for this!
But I can’t find the way to edit the pivot to how I want it. For example, I only need the sum, so I would like to get rid of the rest. Also when it come to the available data, I want certain fields in the drop down and certain others to move around in the Pivot. Is there a way to edit these?
Hi, Anne Marie.
Last year we launched https://carafe.fm a free open-source tool for implementing JavaScript in FileMaker. Take a look at a more up to date example here: https://carafe.fm/bundle/widget-studio-pivot-table-1-0-1/ and leave a comment there if you have questions.