Default = off?
When you install FileMaker Server, it does NOT log any performance metrics by default. When it comes to troubleshooting, you are flying blind.
These are its default settings:
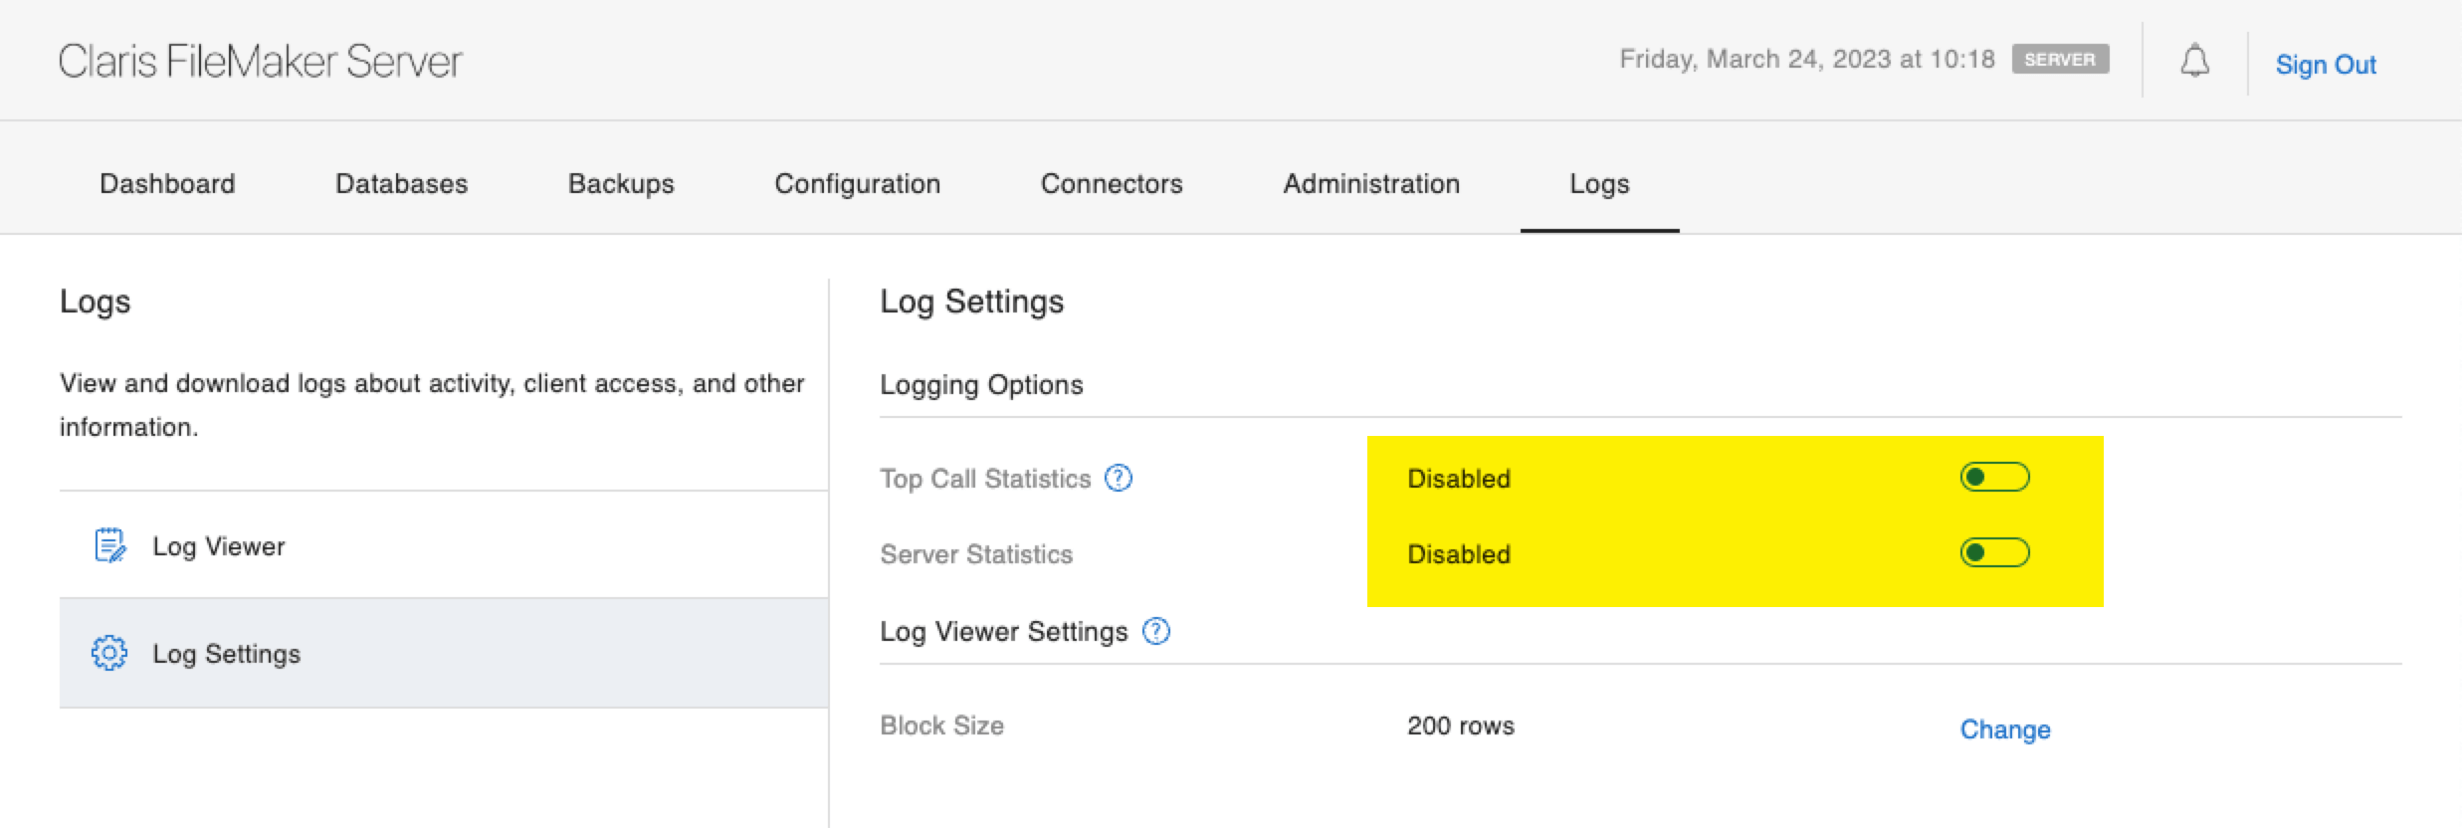
There is also a third performance log, named the ClientStatsLog, that doesn’t even show up on the admin console.
Having no performance stats is bad. But even worse, when you set out to enable the Top Call Stats log, you receive a warning that it may impact your server’s performance:
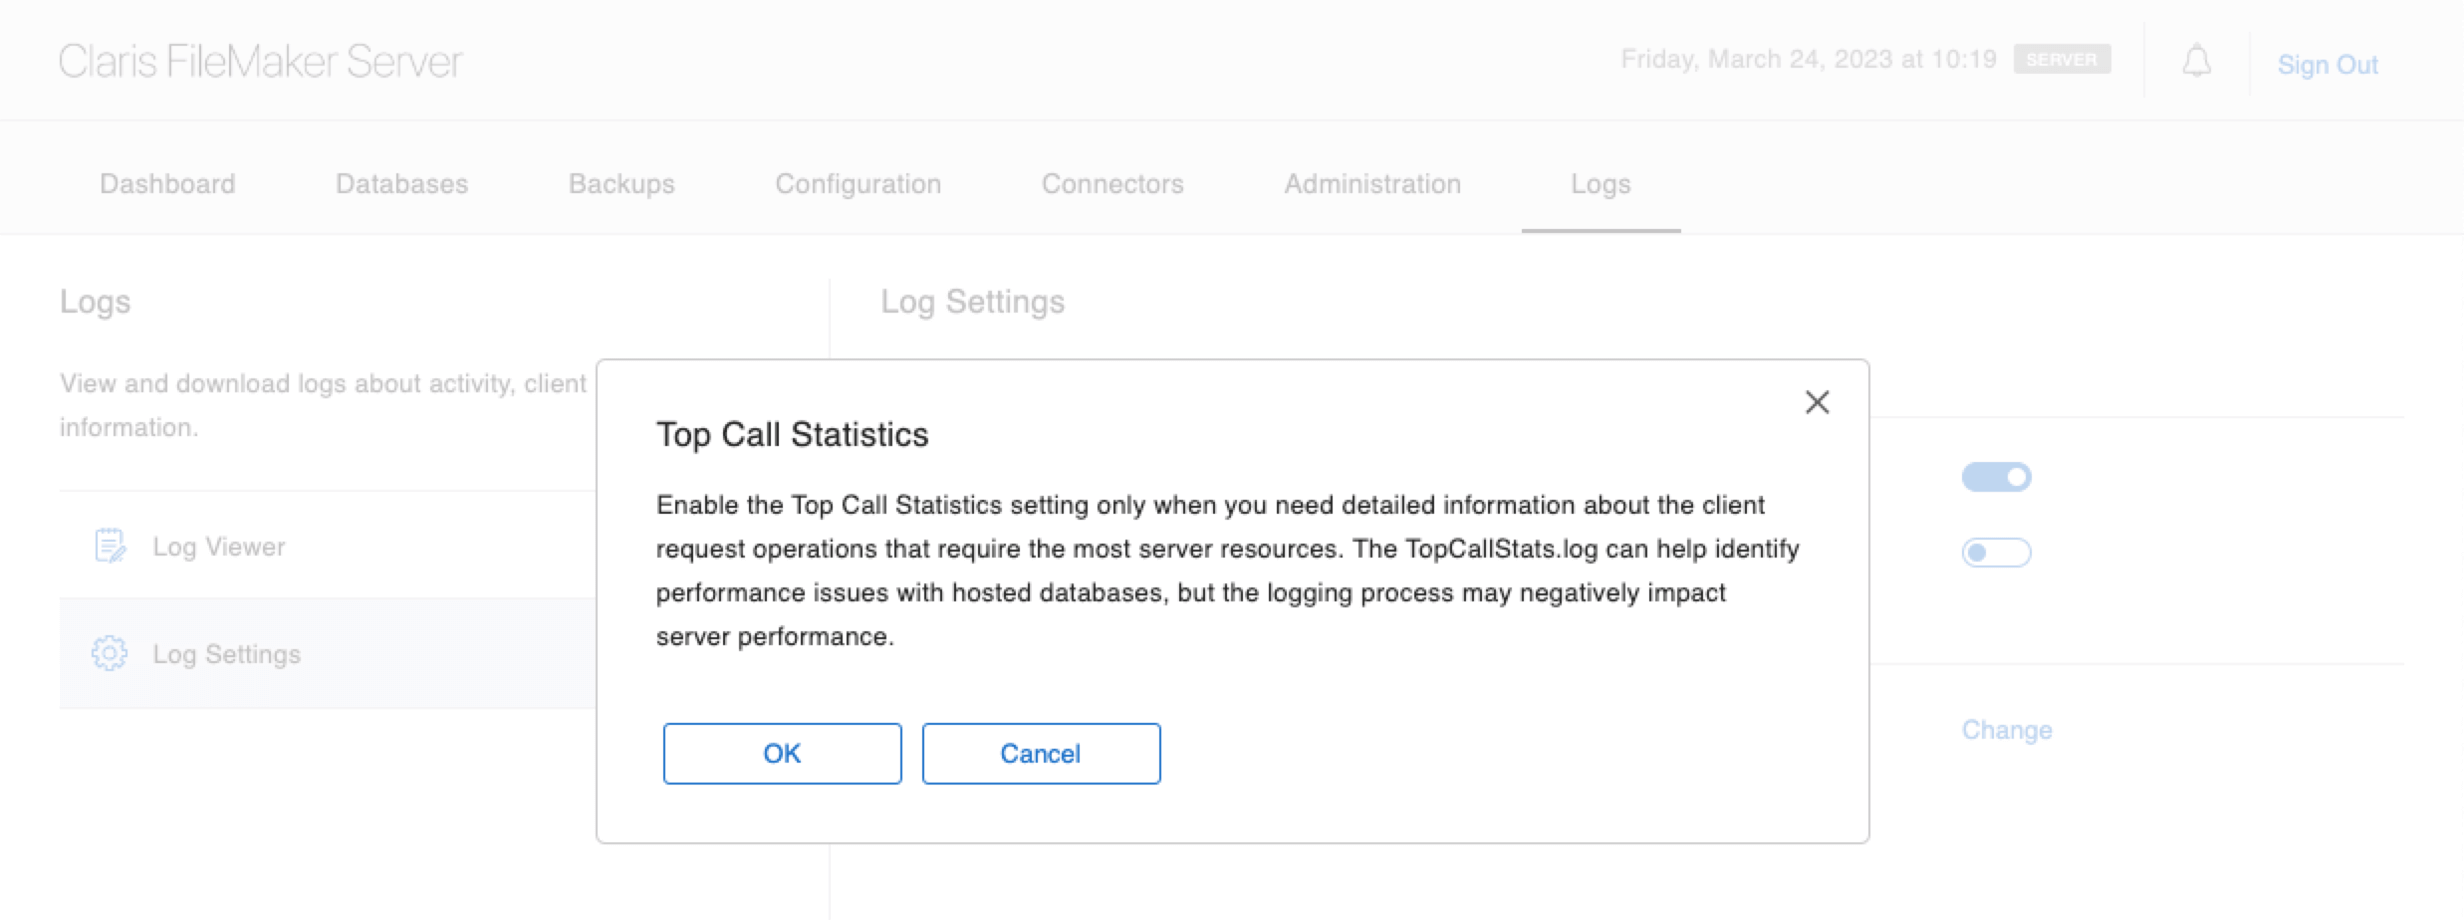
That warning is sufficient to scare most customers into hastily turning it back off.
And yes, I have a big opinion on this – that warning does more harm than good. And the logs should be on by default. When we are tasked to help find out why a particular deployment has performance issues, invariably, we find that there is nothing to go by. Those invaluable logs are turned off, and there is no relevant set of data on which to base any conclusions. When we ask for the logs to be turned on, we must explain that the warning they were so afraid of is meaningless.
To put it bluntly: if turning on the logging makes the server fall over, then the deployment has much bigger problems than dealing with the little bit of load that the logging adds.
What is the Impact?
So let me put my money where my mouth is. How about actually testing the impact?
We have a tool named Punisher that we use to test FileMaker Server. It is ideally suited to test the impact of logging since it goes through a series of taxing operations that cover most anything that developers do in their solutions.
For a server, we wanted to pick something low-performing and easily overwhelmed. This should amplify the impact of the extra load added by the logging.
We chose an AWS t3a.large instance, which is a woefully underpowered machine for most FileMaker or Claris deployments. It only has two processor cores running at a modest speed and has no turbo speed to help cater to high processing demands. The disk i/o for the instance is plain vanilla general purpose SSD (gp3), with the default values of 3,000 iops and 128MB/s throughput. Using Punisher, we performed five runs, each with logging turned off and on. Each run spawned five concurrent sessions to make sure that the two cores were stretched beyond their capabilities. This ensures the extra load of logging would not get lost in the spare computing capacity of the server.
Enabling All Three Logs
When testing with logging on, we enabled all three logs: Stats.log, TopCallStats.log, and ClientStats.log.
Each session logged how many seconds it took to complete its tasks. We have 50 data points: 25 with logging and 25 without logging.
Results for Logging Turned Off
With logging turned off, its 25 sessions combined took 42,792 seconds (11 hours, 53 minutes and 12 seconds) and an average of 1,712 seconds per session (28 minutes and 32 seconds) with a Standard Deviation of 111 seconds (1 minute and 51 seconds) between the duration of the individual sessions. (The Standard Deviation basically tells us how each session of the set deviates from the mean. Or, in other words, the standard deviation indicates whether each session is close to the mean or if the recorded times fluctuate a lot).
By removing a percentage of the highest and the lowest recorded times, we can get a better sense of the typical length of a session. That is known as a Trimmed Mean, and we are removing 20% of the data set. The Trimmed Mean per session is 1,699 seconds (28 minutes and 18 seconds) per session.
Results for Logging Turned On
That done, we rebooted the server to create the same starting point and turned on the three logs. With logging turned on, the 25 sessions combined took 42,207 seconds (11 hours, 43 minutes and 27 seconds), with an average of 1,688 seconds (28 minutes and 7 seconds) per session and a standard deviation of 27 seconds between the length of individual sessions in this set. The Trimmed Mean is 1,690 seconds per session (28 minutes and 10 seconds).
And yes, you are reading this right: overall, the combined sessions with logging turned on were faster than with logging turned off. And no: that does NOT mean that with logging turned on your solution will be more performant.
What the numbers do show is that the overall variability in run-time of each session induced by whatever environment variables were at play is a lot more impactful than the small extra load added by the logging.
The Trimmed Mean of the runs show that performance is pretty much equal. The difference between the Trimmed Mean of both types of runs is 0.45%. That difference of 9 seconds is a whole lot less than the smallest standard deviation of 23 seconds for the length of the sessions within the same set. In other words: the ‘natural’ difference you will see in runs of the same functionality drowns the impact of the logging, even on a stressed server.
While testing, the FileMaker Server was not performing any other tasks. It was built just for the purpose of this test. So where does the variation come from? Just the vagaries of computing. Besides the activity generated by FileMaker Server, the Operating System has its own chores to do, however small those are. That activity will impact everything on the machine more so than the logging does.
Bottom Line: What’s the Impact of Logging Your Server?
Does logging impact your server? No, it does not.
Sure, it consumes some resources, but it must. But the effect, even on a badly chosen configuration, is so negligible to be irrelevant.
The same findings are reflected in this 2021 blog post by our colleagues over at Portage Bay Solutions.
Do yourself a big favor and turn all logging on immediately after you install your FileMaker Server or Claris Server.
You can enable two of the three logs from the admin console or enable all three from the command line:
fmsadmin set serverprefs UseStatsLog=true UseClientStatsLog=true UseTopCallsLog=truePlease do so.
Insights from the Log
You can check out our blog posts that cover the valuable information contained in the regular Stats.log and in the TopCallStats.log.
Here is an example of how that information can quickly turn into prioritized insights.
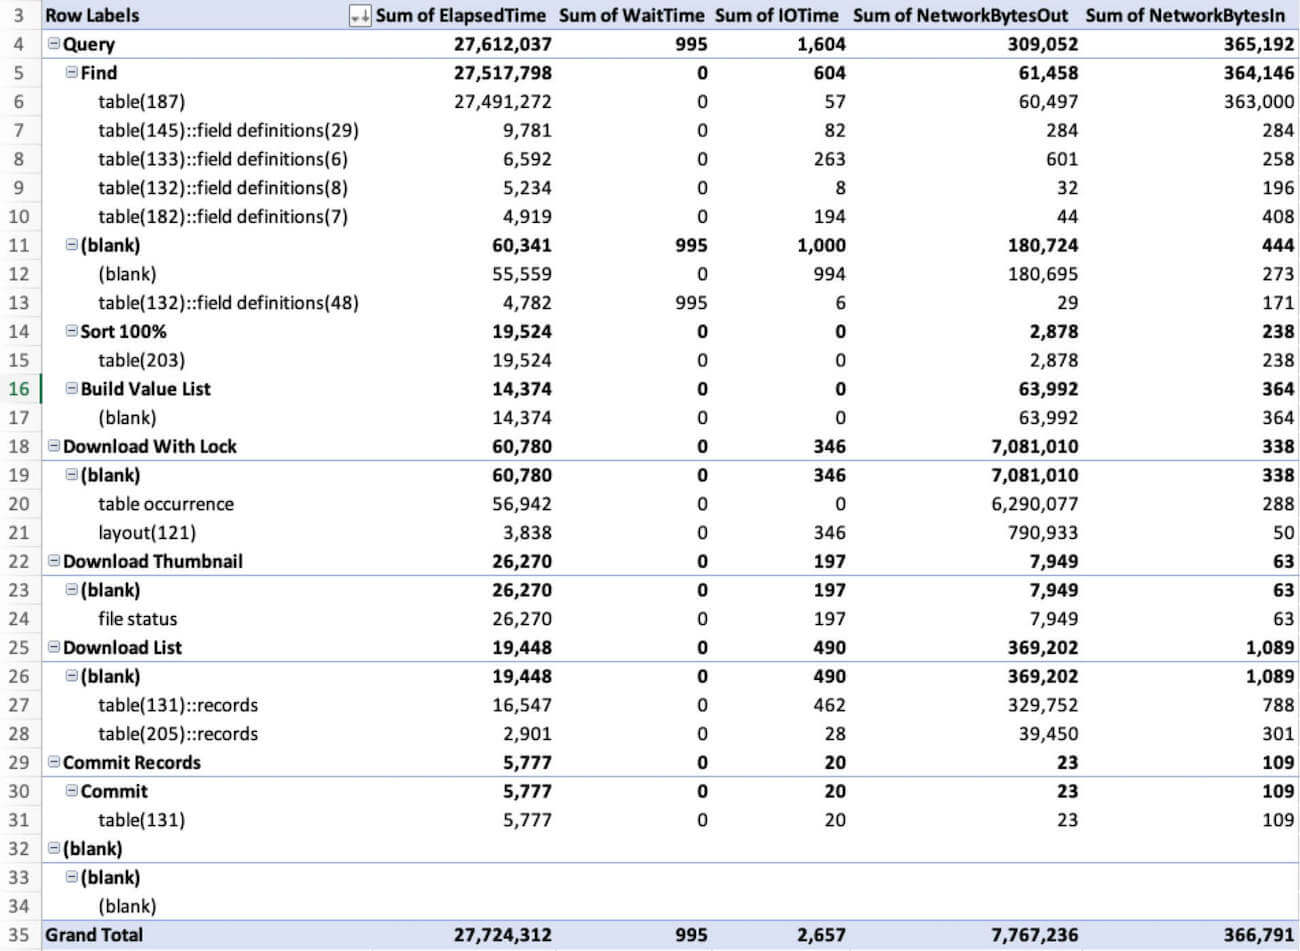
A client is puzzled as to where the slowdowns reported by the users come from. We grab the top call stats log and filter it down to all the operations that took over 1/4th of a second. We then drop that data into Excel and a pivot table to view the data from a few different angles.
What it shows us here is that queries on Table 187 are responsible for consuming most of the processing resources. We should focus our attention on that table.
It also shows us (on line 19) that FM pushes out quite a bit of data just on the collection of table occurrences. That probably means a bad spider graph that, when we optimize it, will perform better.
Within 15 minutes or so of grabbing the TopCallStats.log we’ve identified two priorities. We didn’t have to guess what is wrong with the solution. The log tells us, and we can set it out to fix it.
When you combine this log with the other tools in the FileMaker arsenal, you can use the XML DDR (database design report) and translate the cryptic IDs (table 187) into the actual table and field names. Or you can use one of the leading analysis tools to do this for you.
Next Steps for Your FileMaker Solution
If you’d like more insights into how to make your FileMaker application more efficient, we can help. Contact us to learn more.
Brilliant info, thanks.
Always providing super valuable content Wim!