This post is one in a series of guides that walk you through installing, configuring, and using Zabbix for FileMaker Servers monitoring:
- Part 1: Getting Started with Zabbix
- Part 2: Installing Zabbix as an Appliance
- Part 3: Installing Zabbix from Scratch
- Part 4: Installing Zabbix Agent
- Part 5: Zabbix Configuration (this post)
- Part 6: Using Zabbix
- Part 7: Maintaining Your Zabbix Server and Agents
By this point, you should already have Zabbix server installed on a Linux machine – either as an appliance or installed from scratch – as well as the Zabbix agent installed on one or more FileMaker Server machines.
Zabbix Templates
Zabbix monitors servers and other devices (called hosts) by collecting data (called items) from those hosts. You can tag items with applications which are words or phrases you specify and are used to group and organize the items. Triggers are then used to evaluate the collected item data, and actions are set up to run in response to the triggers. The types of actions you can take include sending notifications and issuing remote commands (performed on the monitored hosts). In addition to automated actions, you can view the collected data in graphs, screens (which you can configure to show multiple graphs and other elements), and dashboards.
You can export some (although not all) of these configuration entities as an XML template and shared across different Zabbix installations. ouBoth FileMaker Inc. and Soliant Consulting have released a set of templates that can greatly speed up the time it takes to set up your Zabbix server and FileMaker Server(s) monitoring.
As you download the templates, you will note that even though there are multiple templates, they are all contained within a single XML file.
Here is a partial list of the configuration entities in the Soliant Consulting template:
Included:
- Host Groups – used for organizing hosts and templates
- Applications
- Items
- Triggers
- Graphs
- Host Screens – used to display data from a single host
Not included:
- Actions (because they depend greatly on your priorities and users/email environment)
- Global Screens – used to display data from multiple hosts
- Dashboards
Importing Templates
To import a template, log into the Zabbix frontend and navigate to Configuration > Templates.
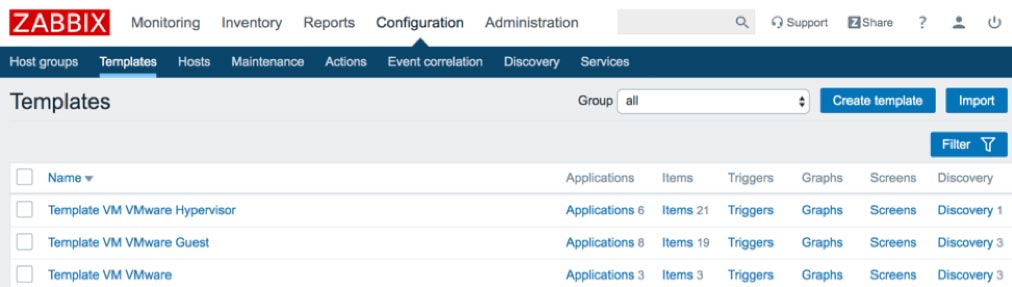
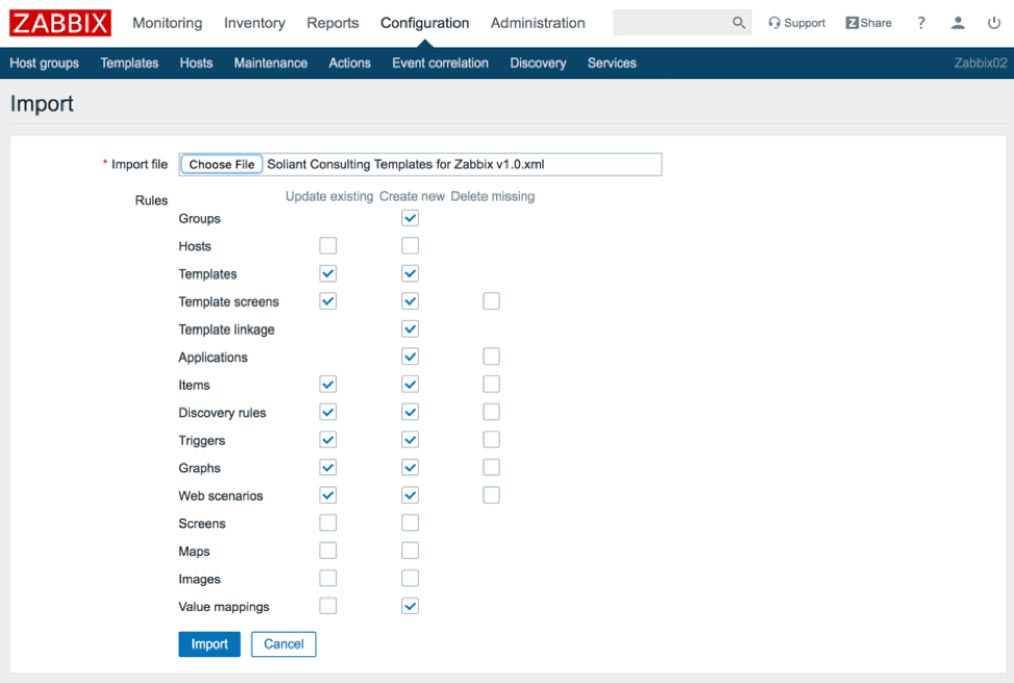
Click Import to go to the import screen, select the template XML file, leave the default import rules, and click Import.
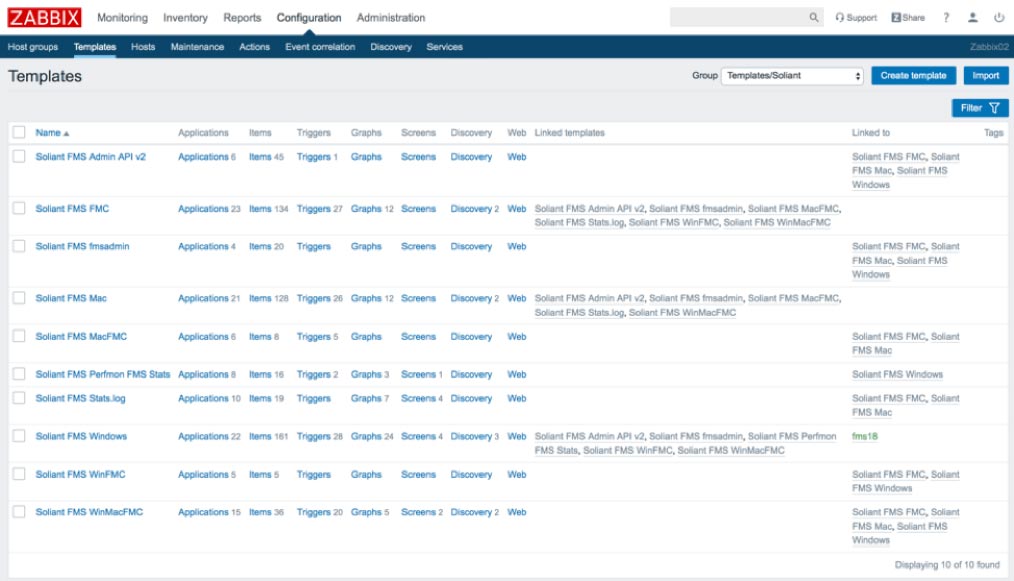
Navigate once again to Configuration > Templates and select Templates/Soliant as the group to only display the templates that were imported and to exclude the predefined templates that come by default with a Zabbix installation.
Template Organizational Scheme
To strike a balance between complexity and flexibility, and to minimize the amount of customization required after importing, we’ve organized the Soliant templates in these two tiers:
- Top-level templates – Intended to link to hosts.
- Component templates – Nested inside one or more top-level templates.
There are three top-level templates – one for each FileMaker Server platform: Windows, macOS, and FileMaker Cloud. These are the only ones that you would select when adding a template to your FileMaker Server host.
Component Templates
The component templates exist to account for variation in cross-platform compatibility. For example, the perf_counter item collects data from the Windows Performance Monitor (Perfmon) tool, so this item will only work with a Windows host.
Using component templates also facilitates configuring Zabbix to monitor different FileMaker Server versions and configurations. For example, as of the writing of this post, the Admin API v2 is only supported with FileMaker Server 18, so items that rely on the Admin API v2 are grouped in their own template.
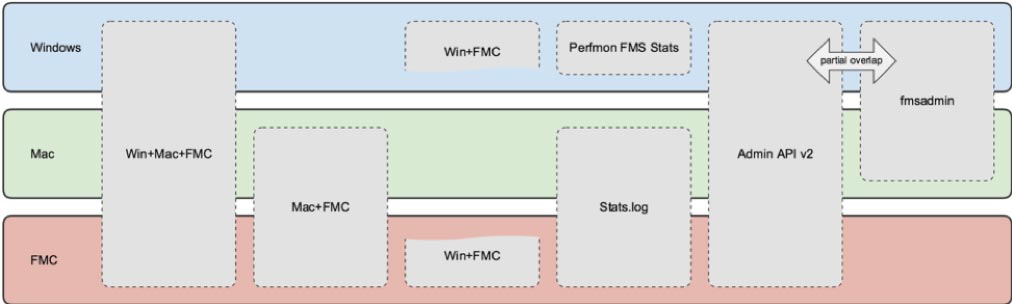
The following schematic visualizes how the top-level and component templates fit together:
To view just the top-level templates, select Templates/Soliant/Top-Level in the Group dropdown. Similarly, you can select Templates/Soliant/Component to view just those templates.
The names of the three top-level templates make their intention self-explanatory: when deciding which one to link to the host you wish to monitor, choose the one that corresponds to that host’s operating system:
An Explanation of the Component Templates
- Soliant FMS WinMacFMC – Includes items that work on all three FileMaker Server platforms.
- Soliant FMS WinFMC – Includes items that work on Windows and FileMaker Cloud but not on macOS.
- Soliant FMS MacFMC – Includes items that work on macOS and FileMaker Cloud but not on Windows.
- Soliant FMS Admin API v2 – Includes FileMaker Server configuration data collected from the Admin API v2.
- Soliant FMS fmsadmin – Includes FileMaker Server configuration data collected from the fmsadmin CLI utility. The fmsadmin CLI tool has diminished capabilities when running on FileMaker Cloud, so for this reason, the fmsadmin component template is only included with the Windows and macOS top-level templates.
- Soliant FMS Perfmon FMS Stats – Includes Windows Performance Monitor (Perfmon) counters that have counterparts in the FileMaker Server Stats.log file.
- Soliant FMS Stats.log – Includes items collected from the Stats.log file.
Each top-level template has been linked to all eligible component templates so that it inherits their configuration entities (items, triggers, etc.). For example, the Mac template has been linked to the WinMacFMC and MacFMC templates (among others) but not to WinFMC, since the items in that template will not work on macOS.
Admin API v2 and fmsadmin Templates
The Admin API v2 and fmsadmin templates both collect FileMaker Server configuration data but through different mechanisms. Some of the items overlap, and others don’t. Review the items available in each template and decide which one you’d like to use. Note that to use the Admin API v2, you must make your host must FileMaker Server 18 with a custom SSL certificate. Zabbix server must also be able to reach the host via port 443. You can also choose to keep both sets of items enabled, in which case, you will end up collecting some redundant data. (You are not restricted to enabling/disabling items at the template level; you can also disable individual items within a template. We’ll cover this in more detail in an upcoming section.)
Similarly, both of the Perfmon FMS Stats and Stats.log templates collect FileMaker Server statistics but through different mechanisms. The data collected with either mechanism is essentially identical. Our Windows top-level template makes use of the Perfmon FMS Stats component template. However, as Perfmon does not work on macOS and Linux, the other two top-level templates use the Stats.log component template.
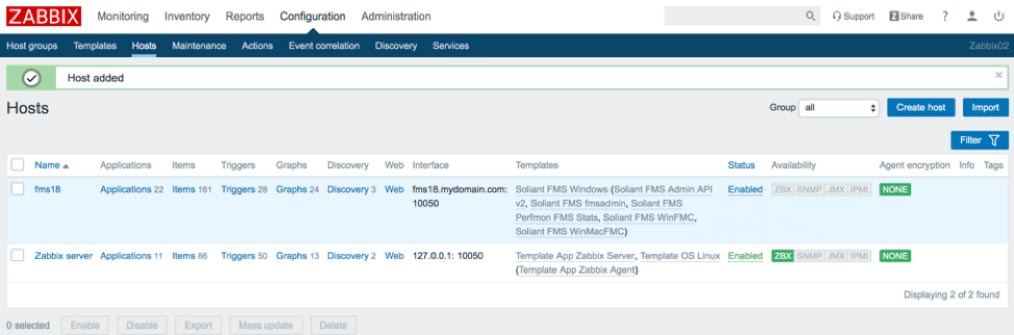
Adding a Host
To add a host, navigate to Configuration > Hosts.
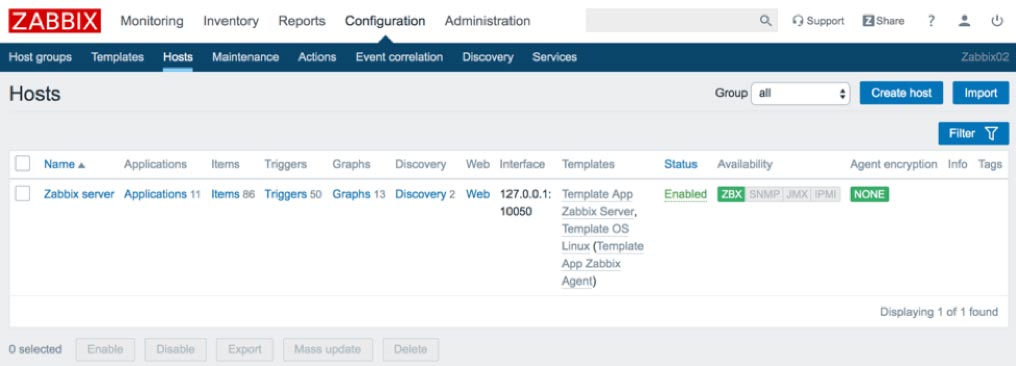
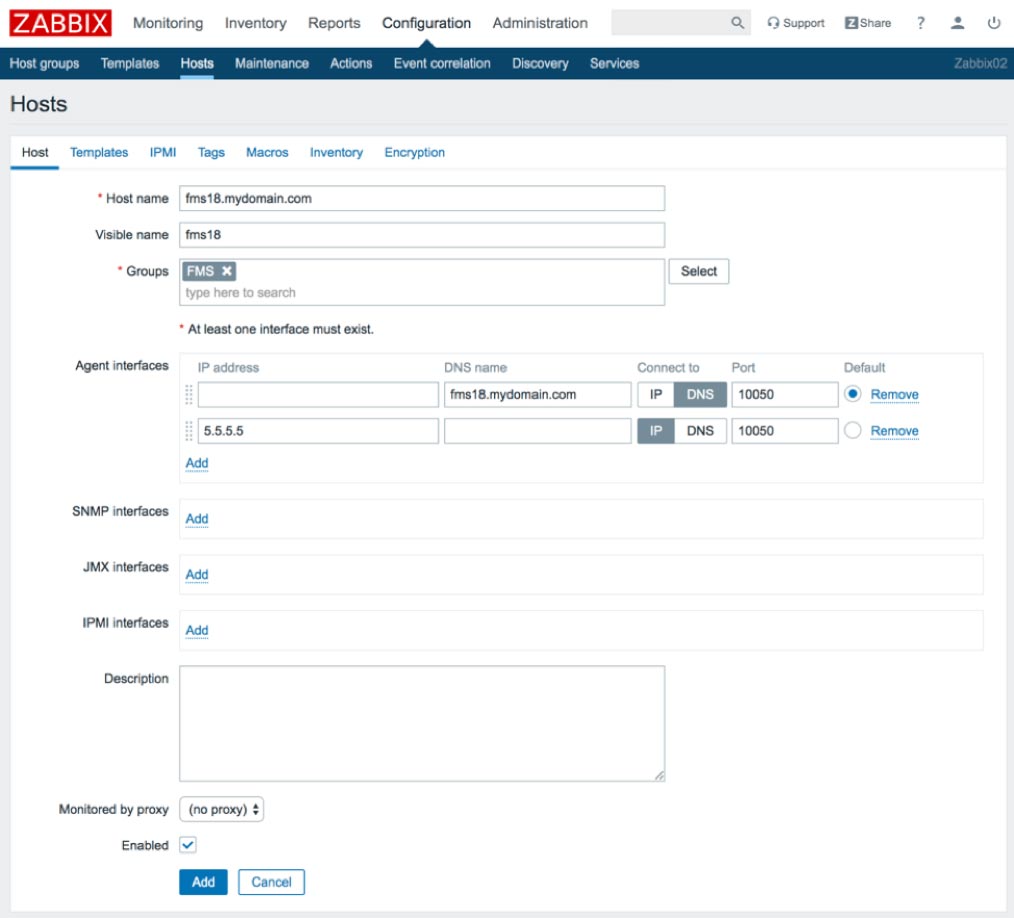
Click Create host and take the following steps on the Host tab:
- Enter the hostname (as set in the agent’s config file) and optionally a visible name (a ‘friendly’ name).
- Select FMS as the group. (The FMS group will have been created as part of importing the Soliant Consulting template. You can select a different group if you would like.)
- Specify either a DNS name or an IP address or both and select the one that you would like Zabbix to use as the default means of communicating with the host.
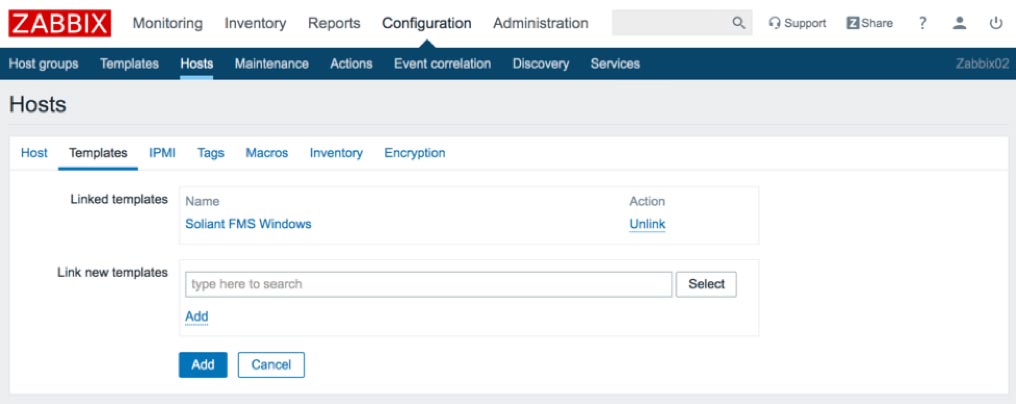
On the Templates tab, select the top-level template you would like to use. We will use the Windows template in the examples shown in this document. Don’t forget to click the blue Add link to add the selected template to this list of linked templates.
Switch to the Macros tab and then to the Inherited and host macros sub-tab. Macros are variables which make it possible to specify values in items, triggers, and other places that would otherwise have to be hardcoded. The top-level template selected during the previous step will have several macros already defined.
Click Change next to each macro whose value needs to change to accurately reflect the environment of the host added.
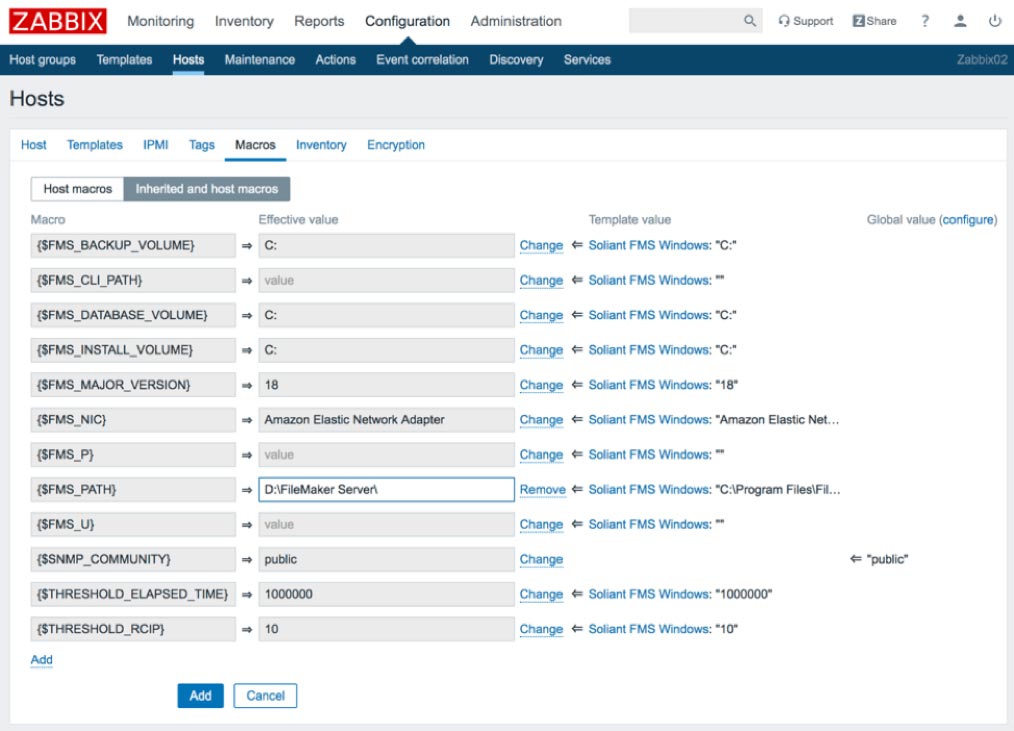
{FMS_U} and {FMS_P} are the credentials you would use to log into the FileMaker Server admin console.
Click the blue Add button to add the host.
Items
Now that you have added a host and linked it to a template, you will want to finetune which items are enabled and how they are configured for data collection, the severity classification for certain triggers, and triggers important to your deployment. For instance: you may not care that the Data API is not running, or you may want a notification when the user load exceeds 20 users.
We will provide a few examples of how to do this, but you may find quite a few other customizations appropriate for your situation. Our advice is to review the list of all configuration entities (applications, items, triggers, graphs, etc.) attached to the host and decide which ones require additional customization.
Item Status – Disabling an Individual Item
One of the items collects data from the Web Publishing Engine (WPE) log. If your FileMaker Server installation does not have WPE enabled, you could disable this item. Doing so will (slightly) lighten the load for the Zabbix server. If you have a trigger tied to this item, then disabling the item would also have the effect of disabling the trigger.
Navigate to Configuration > Hosts and click Items next to the host you want to configure. (An alternate way to arrive at the items screen is to click on the hostname first and then click on Items in the following screen.)
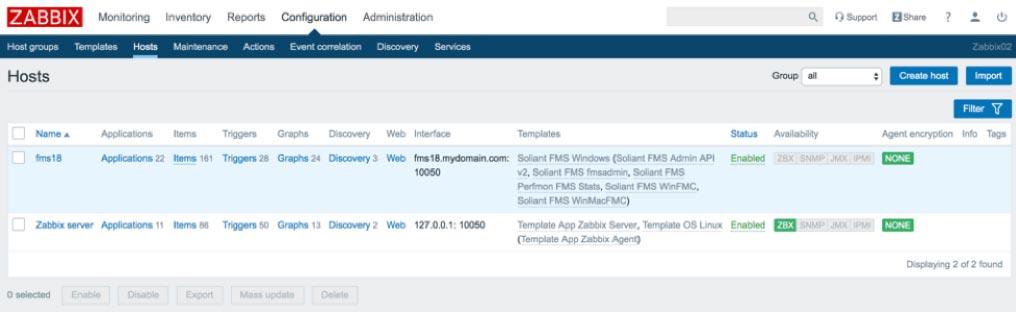
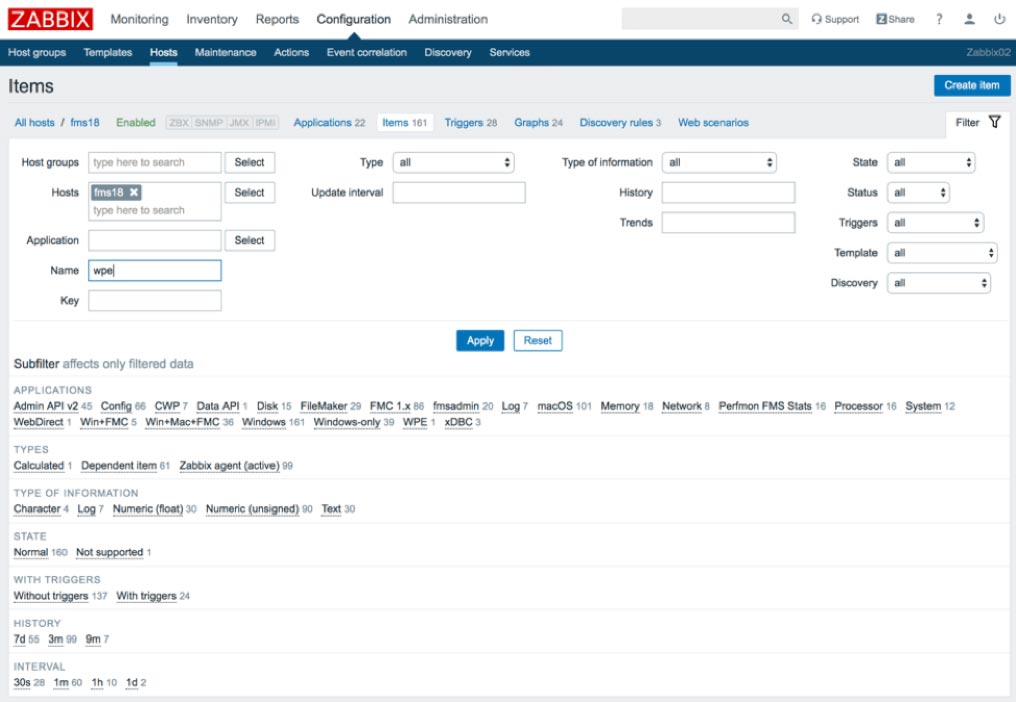
If the search/filter area is not shown, click Filter to display it. (Clicking Filter will toggle the display of that section.) Type “wpe” in the Name field and click Apply.
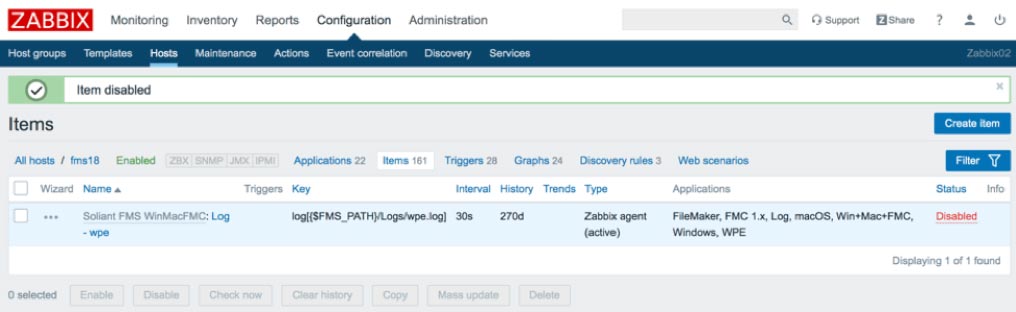
This search should yield a single item, named Log – wpe. Click the green Enabled link in the Status column to disable this item. (The filter section has been hidden in the screenshot below to conserve screen space.)
Using Mass Update to Disable a Group of Items
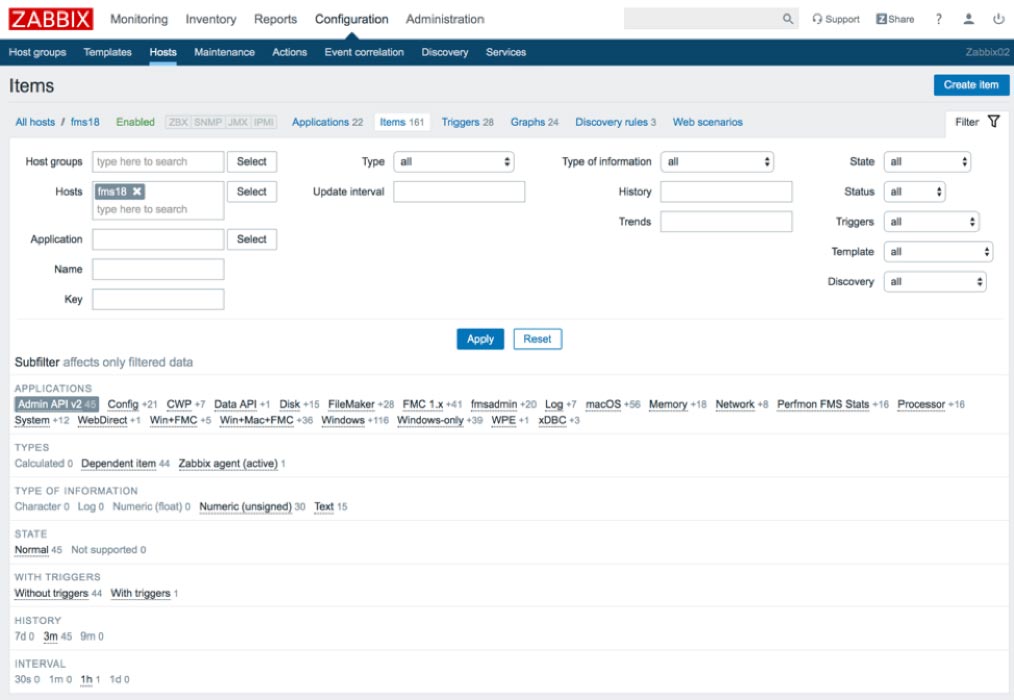
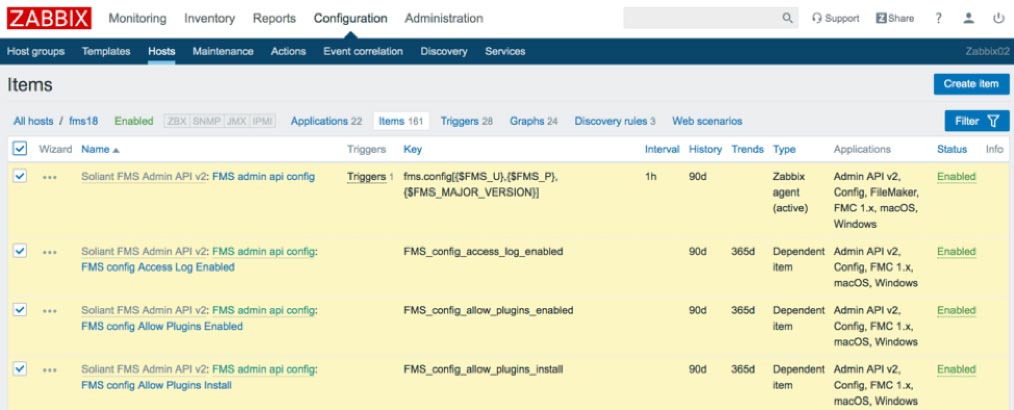
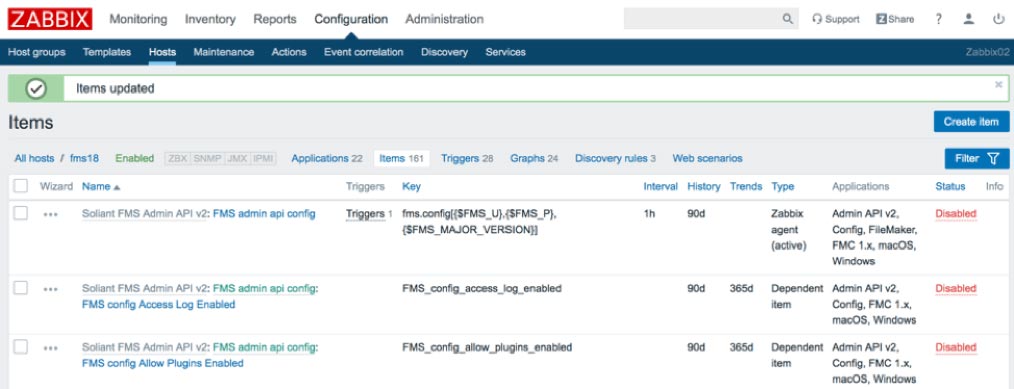
If your FileMaker Server installation doesn’t support the Admin API v2, you may want to disable those items (and all associated triggers). Navigate to Configuration > Hosts and click Items next to the host you want to modify. This time we will search for the items we want to disable by filtering by the Admin API v2 application.
In Zabbix parlance, applications are just tags defined by you (or the template you are using). They provide a means of categorizing items, which makes it easier to filter for items. They are also used for grouping items when displaying a list of collected item values.
Click on the Admin API v2 application in the filter area to see the filter applied immediately. (Note that if you were to then click on another application filter, the effect would be an OR search, not an AND search; i.e., items tagged with either one or the other application will be displayed.)
Click the checkbox at the top of the list to select all items in the search results.
Scroll to the bottom of the page and click Mass update.
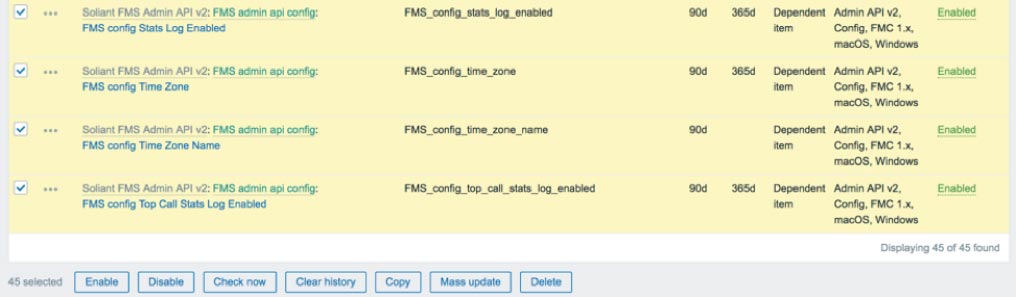
Scroll to the bottom of the mass update screen, click the Status checkbox, and select Disabled in the dropdown. Then click Update.
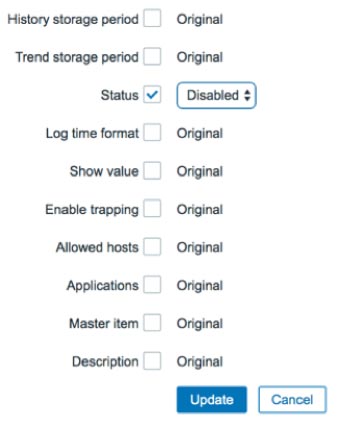
All of the items selected will now be disabled.
You can use Mass Update in this way to make many different kinds of changes to a group of selected items. We will cover several of these in the next few sections:
- Item type
- Time intervals
- Applications
Item Type
Most of the items in our templates are configured to use the passive-mode Zabbix agent type. (See the Zabbix Agent post for a discussion of active and passive modes.)
One advantage of having the items run in passive mode is that you can collect item data on demand as opposed to having to wait for the collection interval to pass. To do so, select the items you want to collect, scroll down to the bottom of the page, and click Check now. Using passive mode does however require that port 10500 is open on the host. If you prefer not to do that, you can change all of the items to active mode.
Changing the type of an item works a little differently from changing the enabled/disabled status. You must do this at the template level instead of the host level, so you will need to navigate to Configuration > Templates and click on Items next to the template whose items you want to modify. If you try to change the item type from a host context, you will notice that the Type field is displayed with a gray background to indicate that it is not editable.
Once you arrive at the item detail screen (from a template context), filter by Zabbix agent type (don’t skip this step!), select all items, click Mass Update, select the Type checkbox, select Zabbix agent (active) to indicate you want the agent to run in active mode, and click Update.
Time Intervals
You should understand three kinds of time intervals:
- The update interval controls how frequently the data is collected.
- The history storage period controls how long the individual data points are kept.
- The trend storage period controls how long the summarized data is kept.
After the history storage period elapses, numeric data is summarized on an hourly basis to conserve storage space. The individual data points are discarded, and the minimum, maximum, average, and the total number of values are kept for every hour. Note, this is done only for numeric data types. Non-numeric data (log entries, configuration settings, etc.) is discarded after the history storage period elapses.
You can adjust the time intervals for an individual item or, using Mass Update, for a group of items. As was the case with item statuses, you can change time intervals for both a host or for a template.
Applications
You can add/edit/delete applications – both for an individual host or for a template – to change how to tag items. You can prepare the application tags you want to use in the Configuration > Templates > Applications or Configuration > Hosts > Applications area. It is also possible to create new applications on the fly when using Mass Update.
Let’s take a closer look at this using an example. The template already has an application tag for “Processor.” Some of the items tagged with this application measure the % processor time for both the overall processor and for the individual FileMaker Server processes. Suppose we want to quickly filter on just these items for one of the hosts we are monitoring.
To do this, navigate to Configuration > Hosts, click Items next to the host where you want to make the change, type “% processor time” in the Name field, and click Apply. Select the items you want to modify and click Mass Update. Select the Applications checkbox and then select the Add tab. Type “% Processor Time” and then select the option in the dropdown to create the new application. Then click Update.
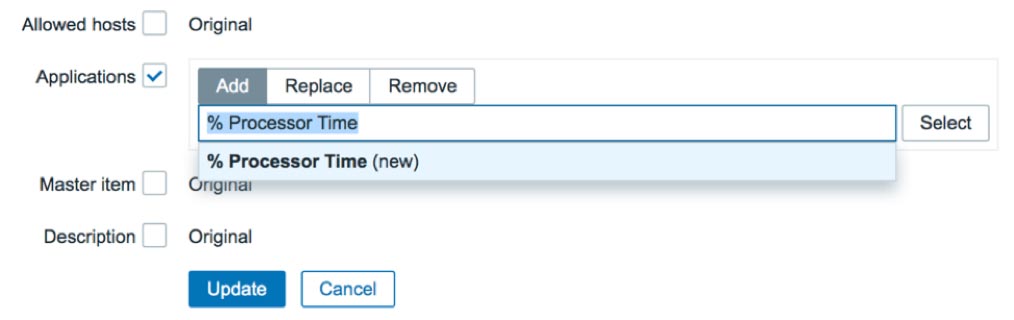
A new % Processor Time application will be created, and all of the items that were selected tagged with it.
User Parameters
Each item is uniquely defined by an item key which describes the type of data collected. Most items in the Soliant Consulting template make use of item keys that are predefined by Zabbix, but there is one item – belonging to the Admin API v2 component template – which uses a custom item key that we have defined in the Zabbix agent configuration file.
Such an item is called a user parameter. The agent configuration file defines not only the item key for a user parameter but also the command used to collect the item data.
In our template, we have named this item “FMS admin api config,” and, for a Windows host, we define it in the agent configuration file as follows:
UserParameter=fms.config[*],powershell.exe -NoProfile -ExecutionPolicy Bypass -file "C:\Program Files\zabbix-agent\scripts\fms_config.ps1" $1 $2 $3For this item to function properly, the fms_config.ps1 file has to exist in the specified path on the host. (The agent configuration file will follow the same format for macOS and FileMaker Cloud hosts although the file and path will be different.) Our agent installation guide provides instructions on how to set this up.
All of the other items belonging to the Admin API v2 component template rely on this item – their item types configured as Dependent Items, which means they derive their value from another item. So, if you want to make use of the Admin API v2 items, you’ll need to set up this user parameter item properly on your host.
Triggers
Zabbix triggers evaluate data that has been collected using items. The evaluation is done using a problem expression. This is a logical expression that you can create so that if it evaluates as true, we know there is a problem. In short; triggers determine whether there is a problem or not.
For example, the following item key collects the percentage of disk space that is free on the C: drive.
vfs.fs.size[C:,pfree]We can use the following problem expression to indicate that there is a problem when the most recently collected value is less than 5%. Note that the item key is referenced inside of the expression.
vfs.fs.size[C:,pfree].last(0)<5To declare that the problem resolved, we can rely on the same problem expression or we can use a separate recovery expression. Or we can do neither, which means we’d have to close the problem manually.
Trigger Status
As was the case with items, you can disable triggers – both individually and using Mass Update. Review the list of triggers provided in the template you are using and disable the ones that don’t apply for your host. For instance, if you do not have the Data API enabled, disable the FMS process not running – Data API – Windows trigger.
Trigger Severity
Each trigger is assigned a severity, which is a designation that you make. The severity of a problem is a subjective assessment that can vary depending on the situation. For this reason,we advise reviewing the severities of the triggers defined in the template and changing them as appropriate.
Modifying Triggers
Let’s take a look at how we would go about changing the severity of a trigger. The FileMaker Server event log records a series of messages depending on what events transpire on the server. See the list of possible messages here. Several of the messages are warnings about possible consistency check issues. For example:
634 – Warning – Database “%1” consistency check skipped by administrator, database opened. Use of this database could result in data corruption.
If you are getting notifications about event log errors, but no warnings, you would miss this message. However, consistency check warnings are indicators of possible serious issues. Our template has a trigger which will create a problem event if it notices this (or similar) message in the event log.
Suppose during review of the triggers used by your host, you notice that the severity of this particular trigger has been set as Average and would like to change it to High.
Triggers List
To see the list of triggers used by a host, navigate to Configuration > Hosts and click Triggers next to the host you are interested in. Type “consistency” in the Name search field and click Apply, or simply look for “Possible consistency check issue” in the list of all triggers shown. (In Figure 18, we’ve toggled the filter section to off, which you can do by clicking on the Filter tab.)
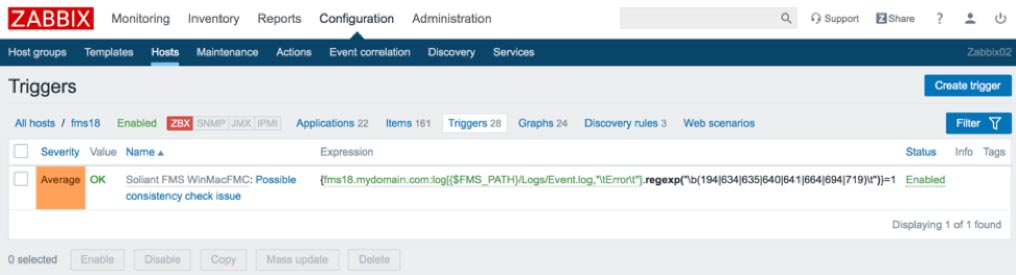
Click on the trigger name to view the details.
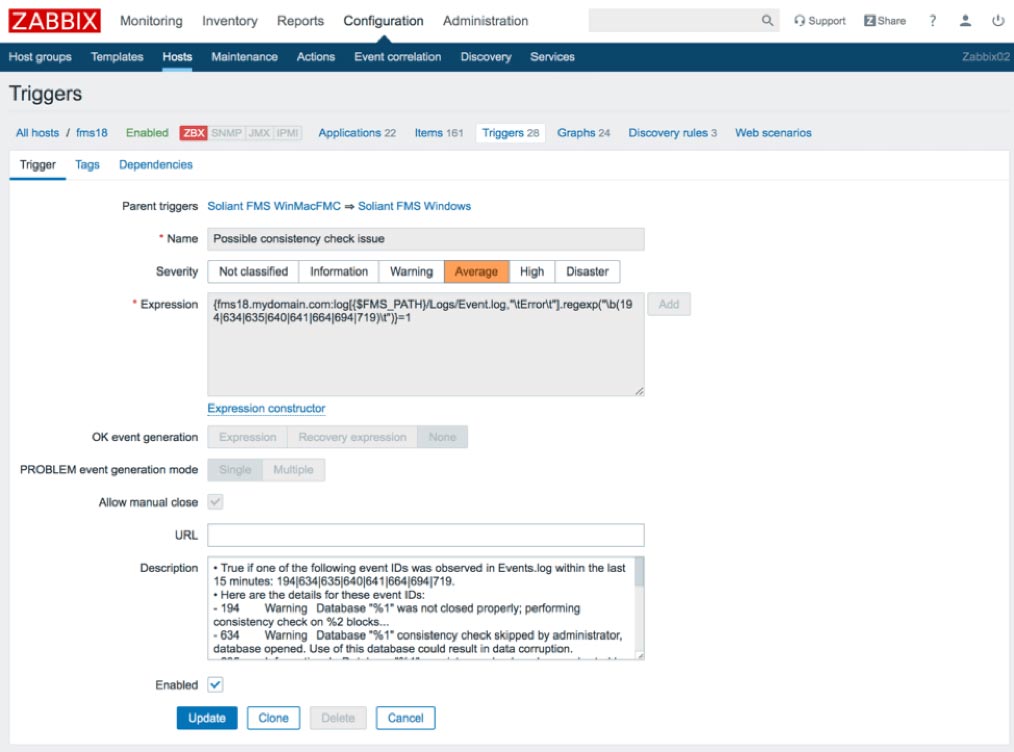
To change the severity, simply select a new value and click Update.
Note that some of the trigger attributes – for example, name and problem expression – are shown with a gray background, which means they are not editable. Because this trigger is inherited by the host through a template, you can only modify these attributes in the template. In this example, this trigger was originally defined in the Soliant FMS WinMacFMC template, which is inherited by the Soliant FMS Windows template.
Click the blue Soliant FMS WinMacFMC link at the top to view this trigger from the context of that template. All of the attributes will now be editable but do keep in mind that changing the values will affect the behavior for all hosts that use this template.
Users
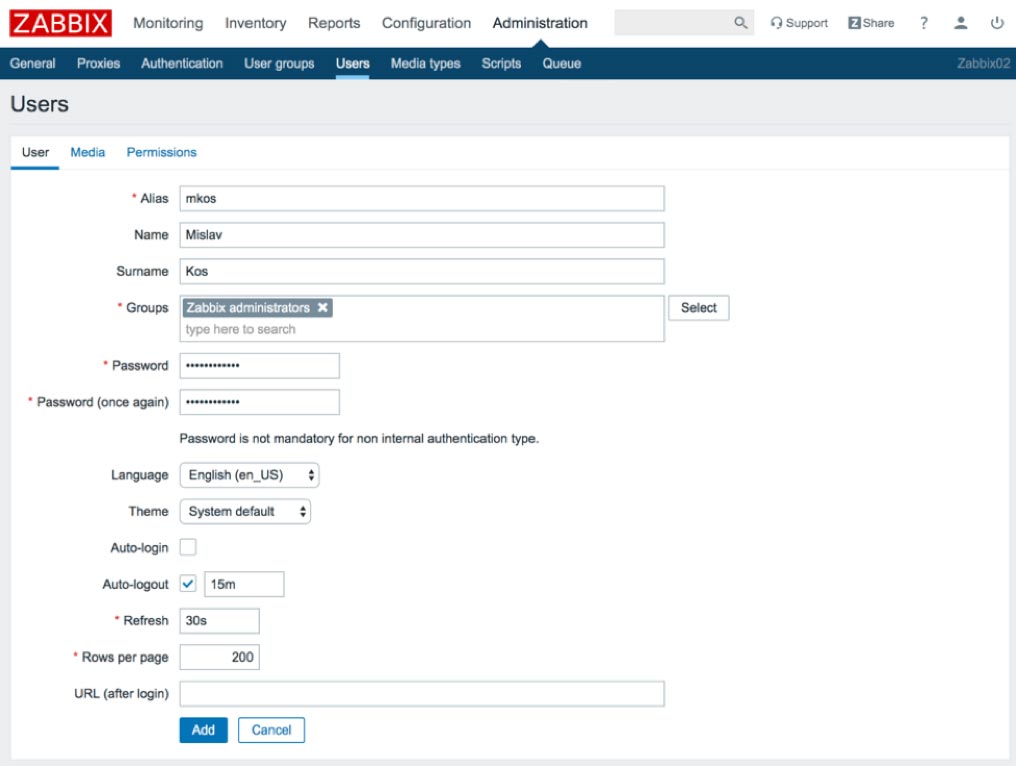
It is a good idea to create a dedicated account for each user who will log into the Zabbix frontend.
Navigate to Administration > Users, click Create user, and fill in the user details. We’ll use the provided Zabbix administrators group for our new user.
Switch to the Media tab, click Add next to Media, and enter your email address.
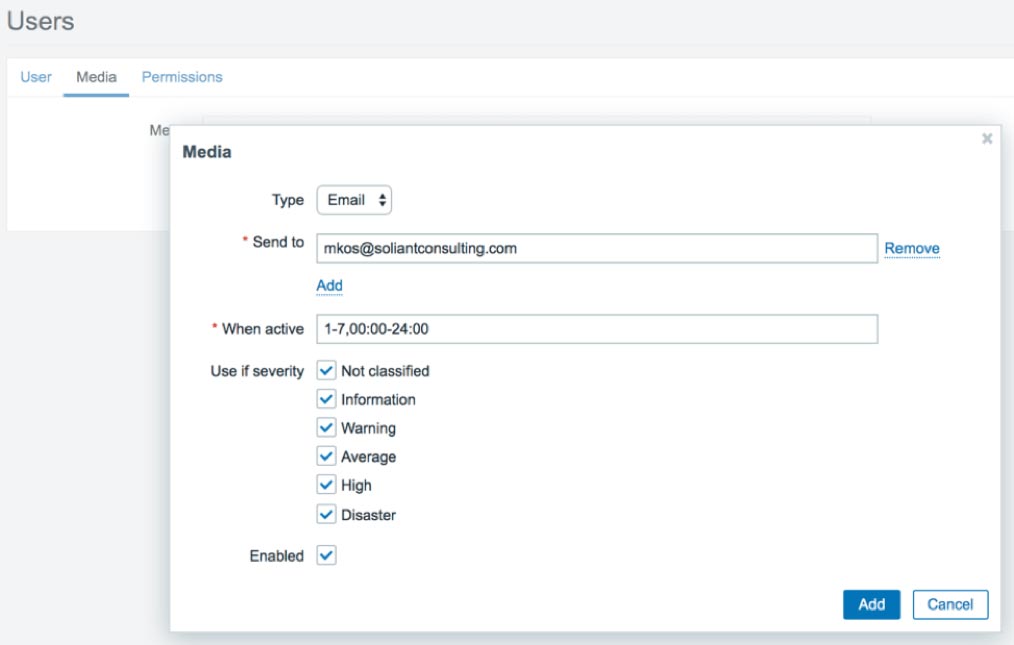
Click Add.
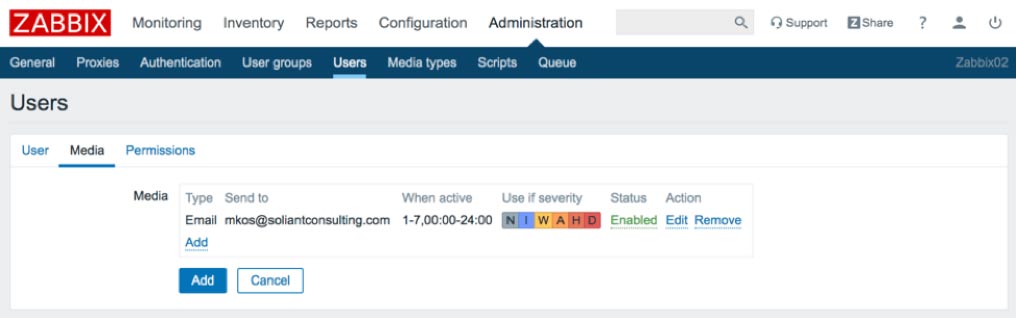
Click Add again to add the user.
Administrators Group
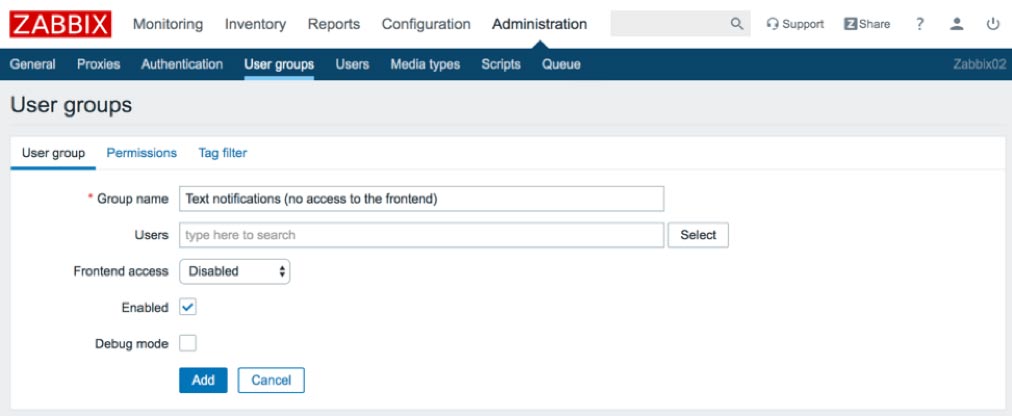
Zabbix already provides a Zabbix administrators group for your accounts. But we will create a new user group here, both to illustrate how to do this, and because we will need this new group later to send out text alerts.
Navigate to Administration > User groups, click Create user group, and specify a Group name. The Frontend access field allows you to specify if the accounts in these groups will be internal or LDAP (Active Directory). In our case, we are disabling access to the frontend (a.k.a. the Zabbix web interface), because accounts belonging to this user group will be used solely for sending out text messages. We explain the reason for this in a later post.
Note: If you decide to use LDAP for your user group, you will still have to create individual user accounts in Administration > Users for every user who needs access. This is different from what you may be used to with FileMaker where you can simply create one externally authenticated account for an entire Active Directory group. It then delegates authentication for all users belonging to that group to Active Directory.
Switch to the Permissions tab, specify the FMS host group (added as part of importing the Soliant template), select to Include subgroups, and select Read permissions.
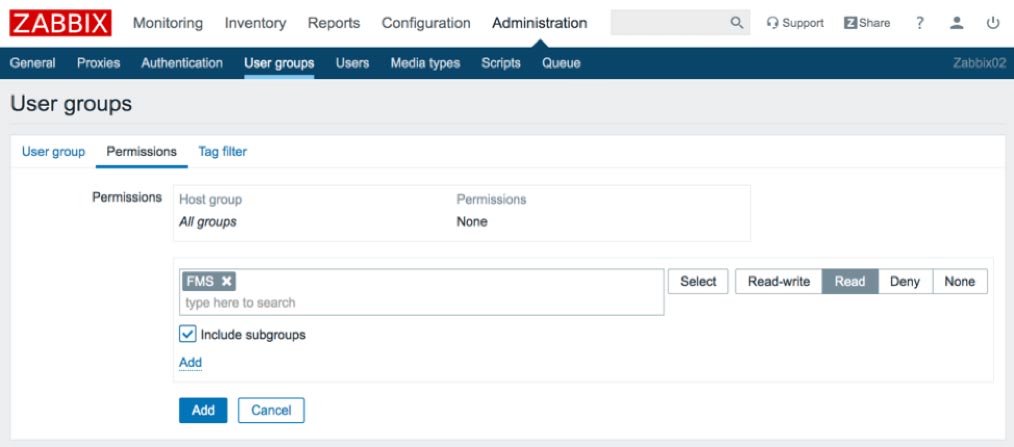
Click the blue Add link to add the host group. (Don’t click the blue Add button yet at this point.)
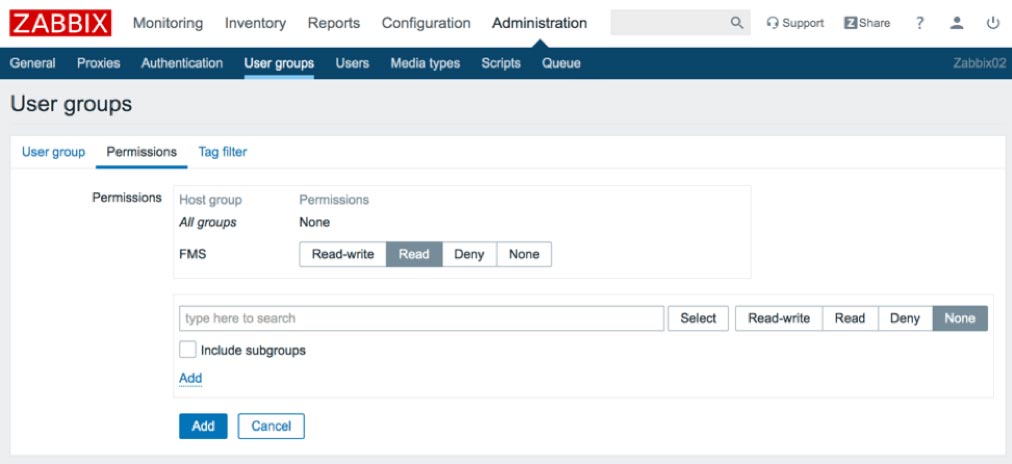
Now click the blue Add button to add the new user group.
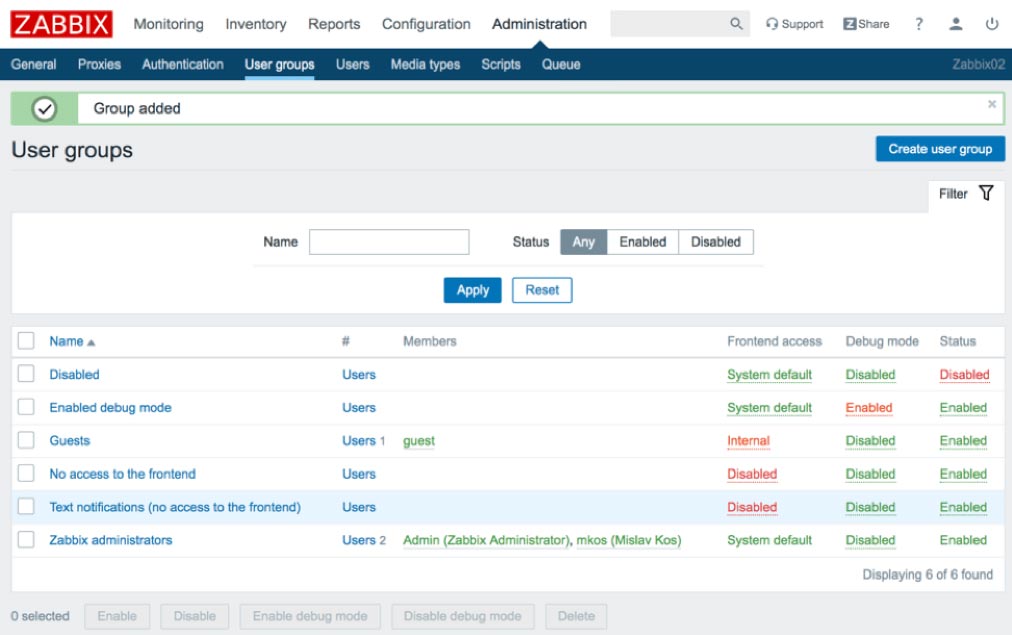
Figure 27. The new user group displayed in the User groups list
Actions
Having problems identified automatically is nice but not very useful if you have to log in to the Zabbix frontend to see that a problem occurred.
Creating actions solves this issue. There are two types of actions:
- Notifications – sent via email, text, or even chat (Slack, RingCentral Glip, etc.)
- Remote commands – Executed on the host; e.g., restart FileMaker Script Engine
Unfortunately, actions cannot be shared using a template, so you will have to create them from scratch.
Email Notifications
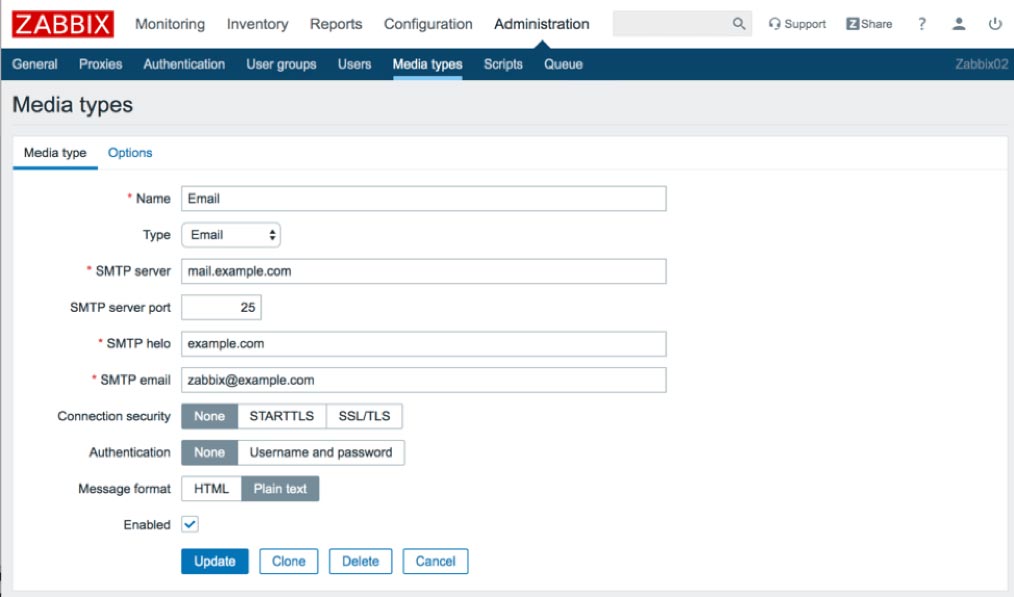
To enable email notification messages, we first have to enter the SMTP email server information. Navigate to Administration > Media types and click on the Email media type. Enter the information for your SMTP server and click Update.
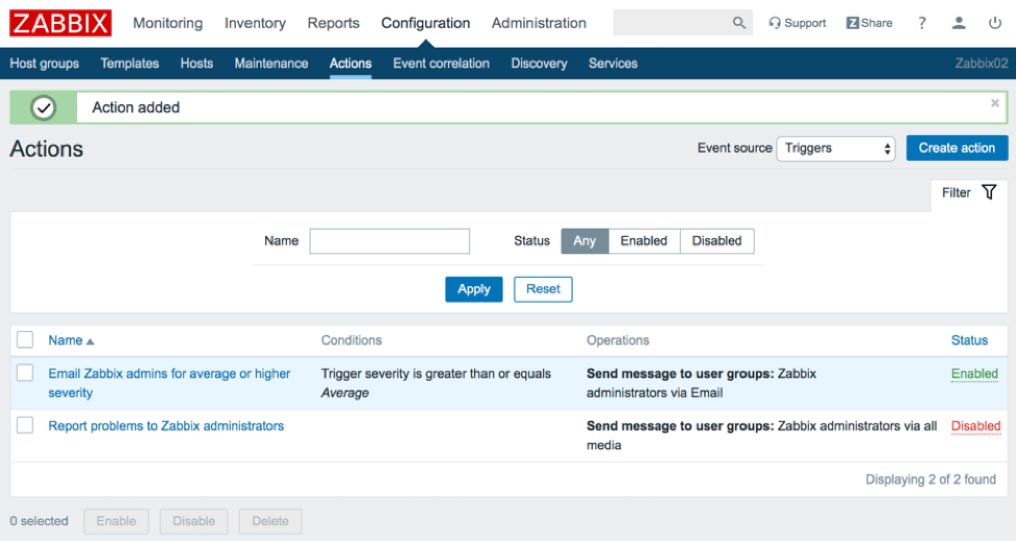
We have already specified an email address for one of the users in the Zabbix administrators group in the Users section. We can now create a new action to send an email (using the Email media type) to all users belonging to the Zabbix administrators user group. As an example, we will set up the action to send emails for triggers whose severity is average or higher.
Navigate to Configuration > Actions and click Create action. In the Action tab of the detail screen, give the action a name and specify a new condition where trigger severity is greater than or equal to average.
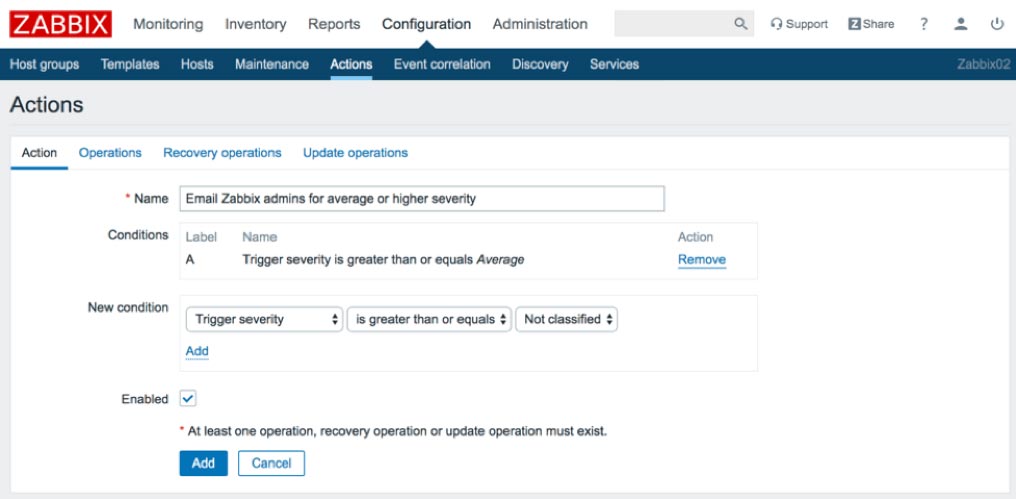
Click the blue Add link to add the new condition, but don’t click the blue Add button yet. Instead, switch to the Operations tab and add the following to the bottom of the default message to provide additional helpful information in the emails sent out:
Item value: {ITEM.VALUE}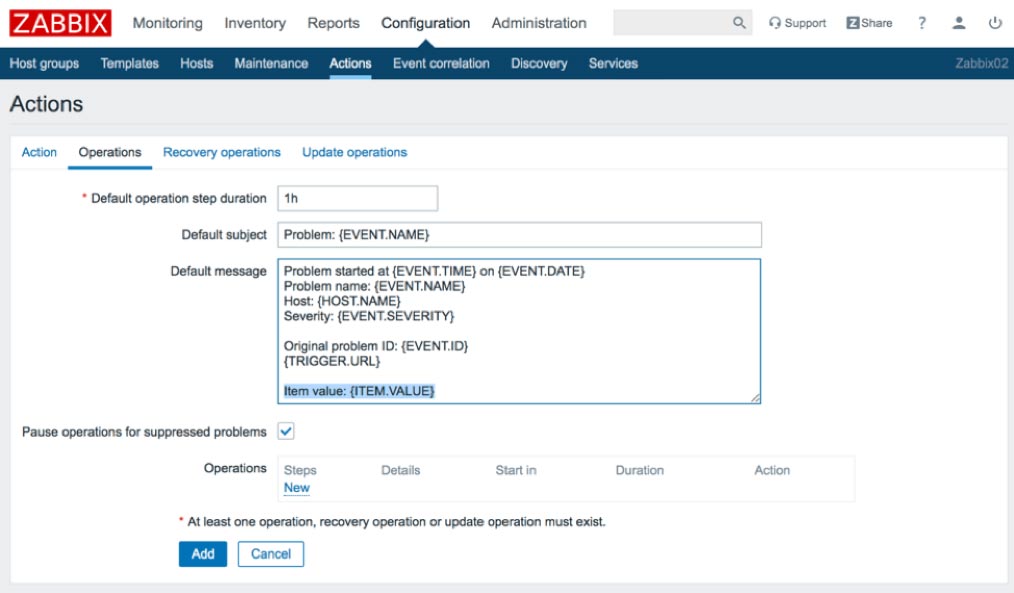
Click New to create a new operation step. Then click Add next to Send to User groups and select the Zabbix administrators user group. The Operation type is already set to Send a message. If we wanted to configure a remote command instead of sending a message, this is where we would specify that. Select the Email media type as the Send only to value.
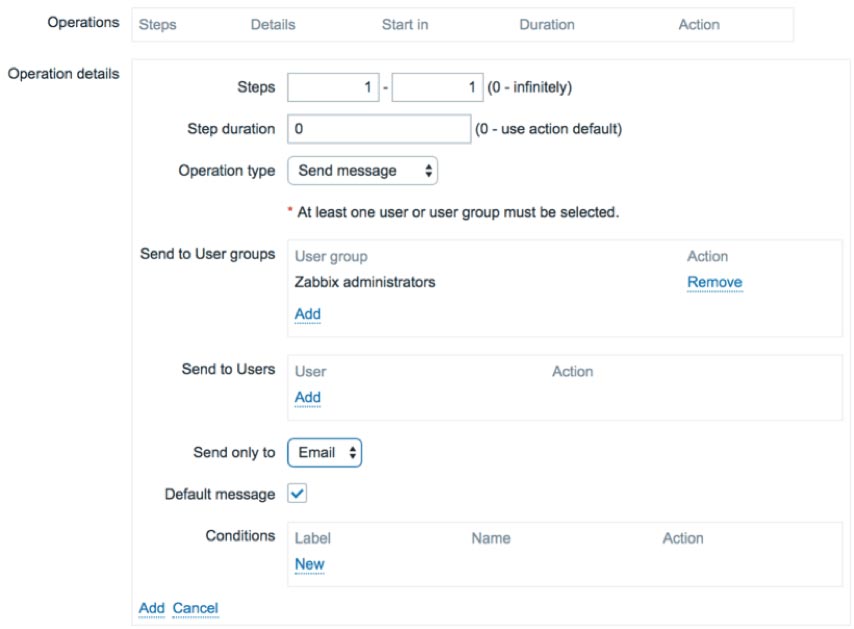
Click the blue Add link to add the new operation step.
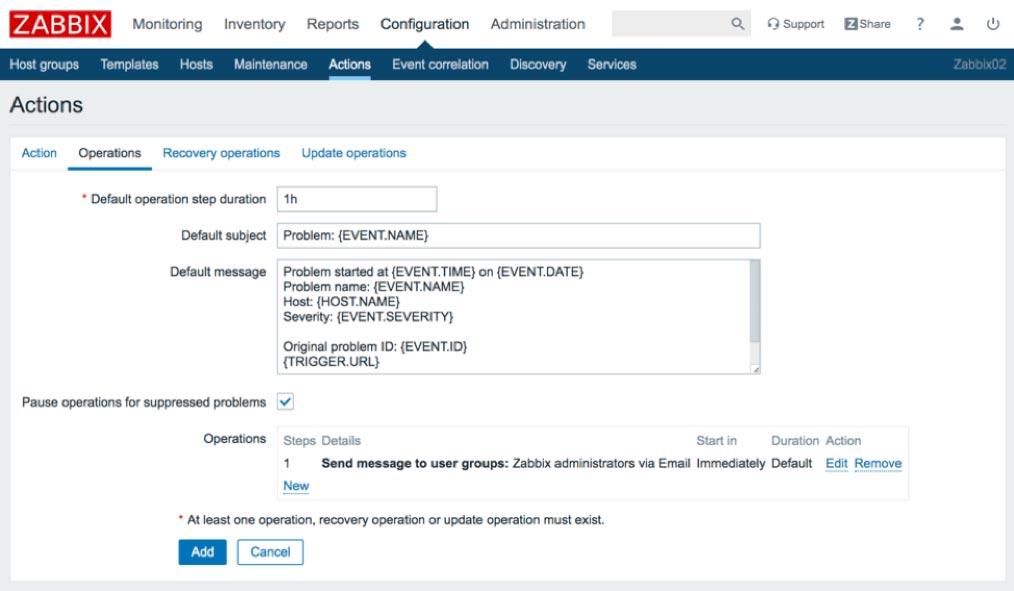
Operations Tab
The Operations tab defines the operations (i.e., actions) taken when a problem is first identified. The Recovery operations and Update operations tabs define the actions taken when a problem is resolved or updated. (We haven’t covered problem updates yet, so we’ll do so briefly here. Once created, you can update a problem by navigating to Monitoring > Problems and working with the problem there. For example, an update can take the form of acknowledging the problem. Doing so lets others know that you are on the case.)
It’s a good idea to receive email notifications not just for identified problems but also for their resolved or updated statuses. Repeat the steps documented above to create the same operation step in the recovery and update tabs. Finally, click Add to add the action.
Text Notifications
You can use the predefined SMS media to send text message notifications, but this approach requires a GSM modem connected to the Zabbix server. Fortunately, you have an alternative, more practical way of sending text alerts.
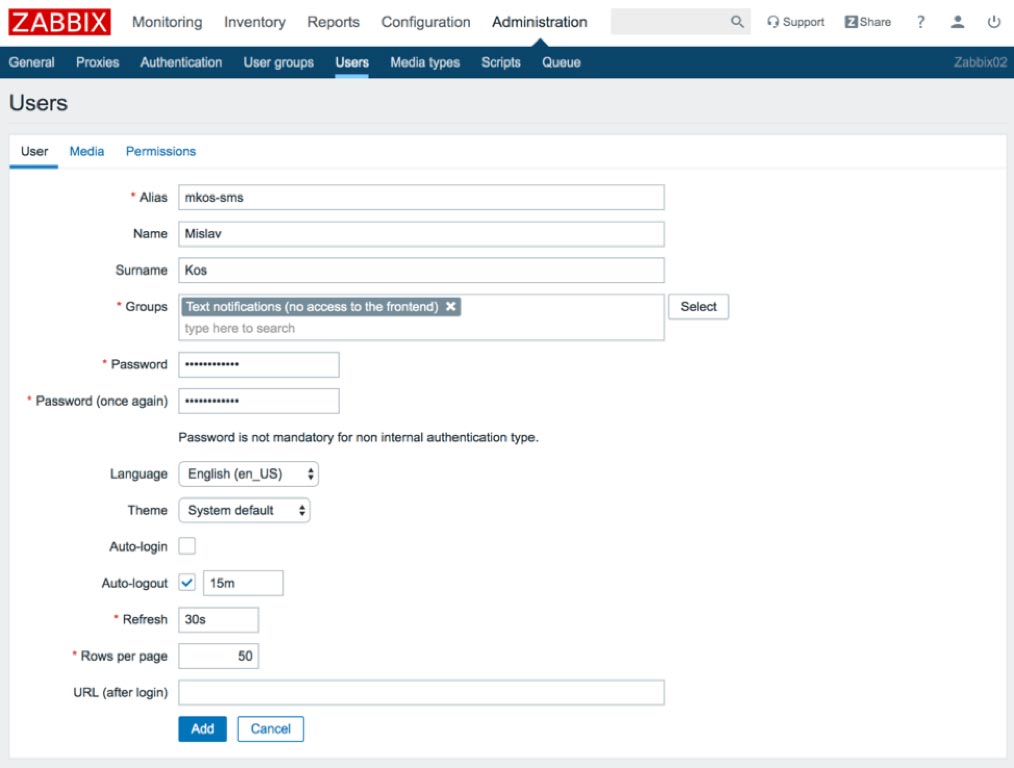
We have already specified a Text notifications (no access to the frontend) user group in the User Groups section of this post. Now we’ll need to create a new user account belonging to that group.
Navigate to Administration > Users and click Create new user. Enter in the basic user information and attach this user to the user group we created earlier.
Switch to the Media tab and click the blue Add link next to Media. We’ll keep the Type as Email even though we are setting up text alerts. Many telecoms provide an SMS gateway, used to send SMS to mobile phones via email. Construct the email address by using your phone number as the local-part of the email address (i.e., the part preceding the @ symbol) and the SMS gateway as the domain. For example, the email address for the +1-312-555-1234 phone number, serviced by T-Mobile, will take the form of 3125551234@tmomail.net.
Here is a partial list of available SMS gateways:
| Carrier | SMS Gateway |
|---|---|
| Alltel | @message.allte.com |
| AT&T | @txt.att.net |
| Boost Mobile | @sms.myboostmobile.com |
| Cricket | @sms.cricketwireless.net |
| Cricket Wireless | @sms.cricketwireless.net |
| Google Fi (Projext Fi) | @msg.fi.google.com |
| Metro PCS | @mymetropcs.com |
| Project Fi | @msg.fi.google.com |
| Republic Wireless | @text.republicwireless.com |
| Sprint | @messaging.sprintpcs.com |
| T-Mobile | @tmomail.net |
| U.S. Cellular | @email.uscc.net |
| Verizon | @vtext.com |
| Virgin Mobile | @vmobl.com |
| Xfinity Mobile | @vtext.com |
Consider changing When active to a time period that corresponds to regular business hours. If you plan on enabling a separate action that sends out email notifications, you will still get those 24/7. In that case, you may not need to receive those same messages as text alerts during night hours.
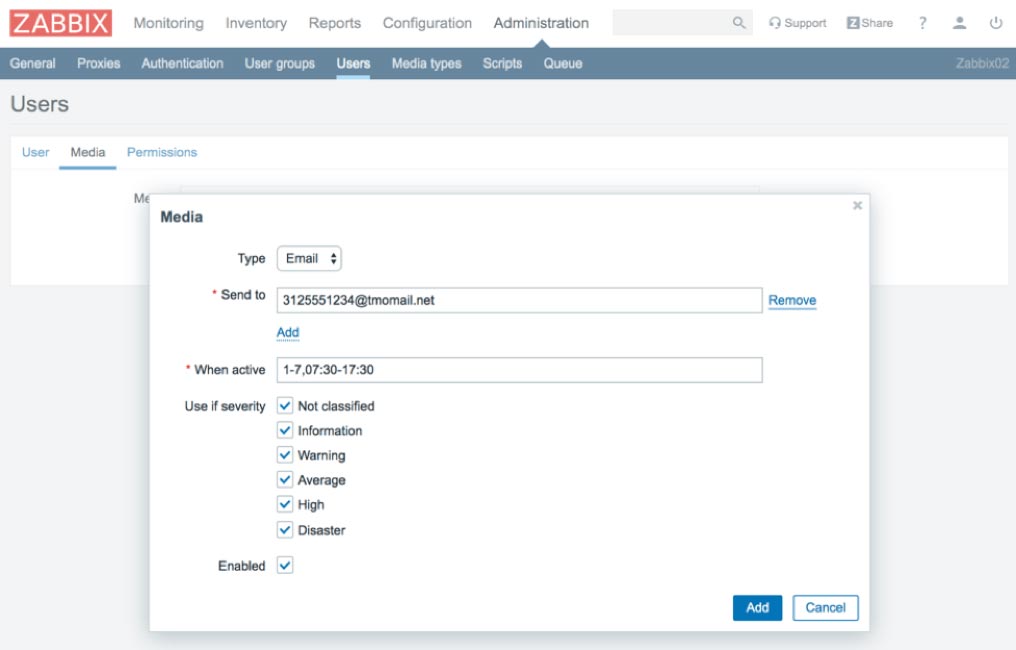
Click Add to add the media and then click Add again to add the new user.
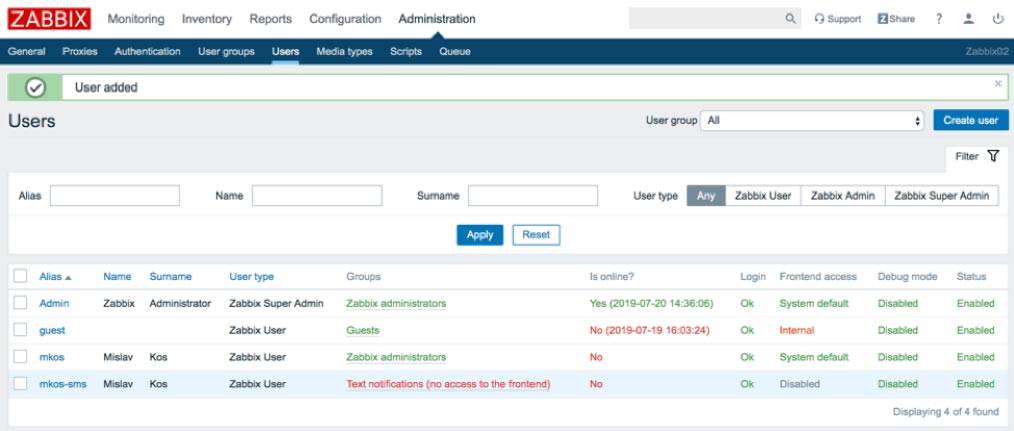
Now add a new action the same way as before, but this time use the Text notifications (no access to the frontend) user group instead of Zabbix administrators.
Remote Commands
As an example, we will set up an action that will start the FileMaker script engine if we notice that it is not running.
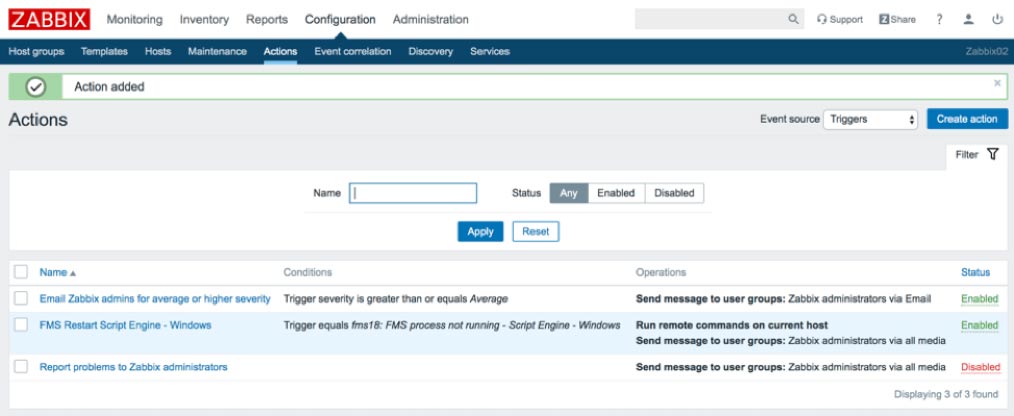
Navigate to Configuration > Actions and click Create action. Give the action a name. Select Trigger in the first New condition dropdown. Click Select, and select the FMS process not running – Script Engine – Windows, and click Select. Click the blue Add link to add the new condition.
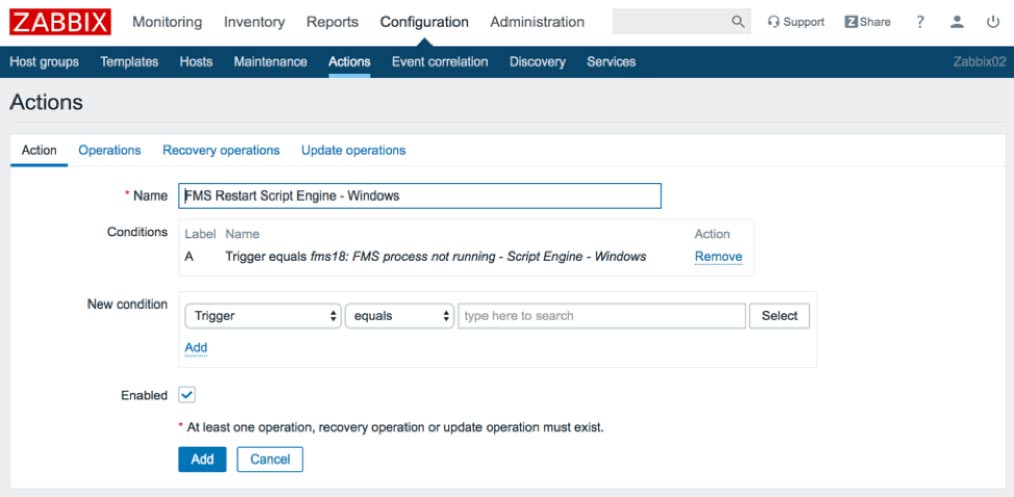
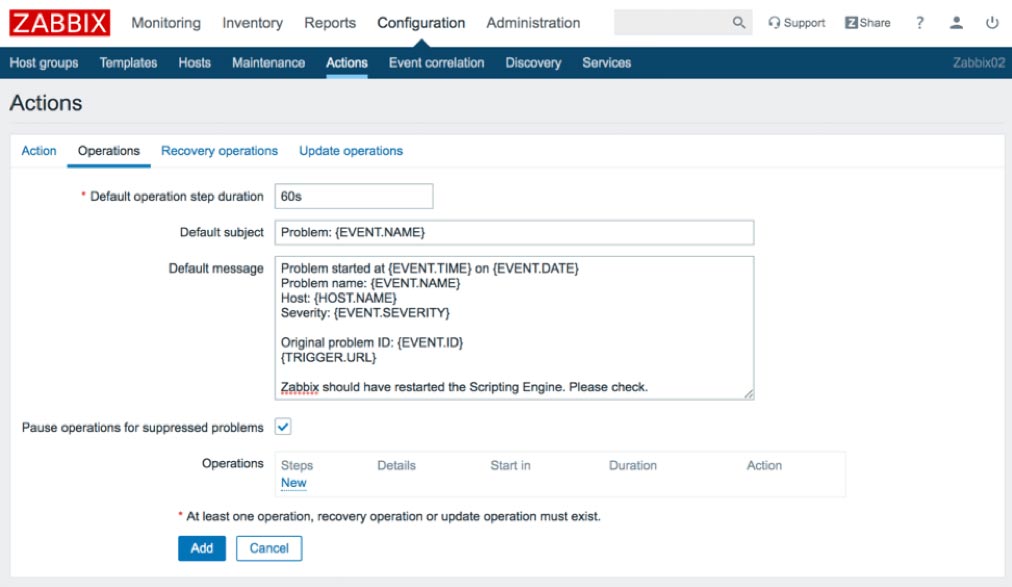
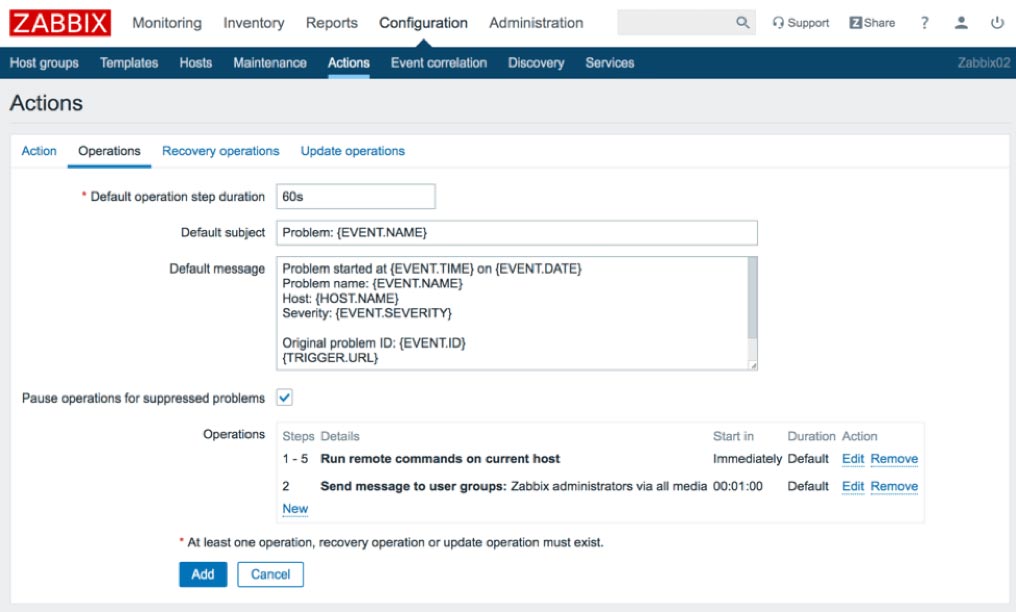
Switch to the Operations tab and change the default duration to 60 seconds and optionally modify the message.
In a moment, we will add two operations to this action. The first will issue the remote command, and the second will send an email notification. Those two commands must happen in sequence with the first one finishing before the second one can happen. For this reason, we change the duration from 1 hour to 1 minute, so that we don’t have to wait an hour for the email notification to send.
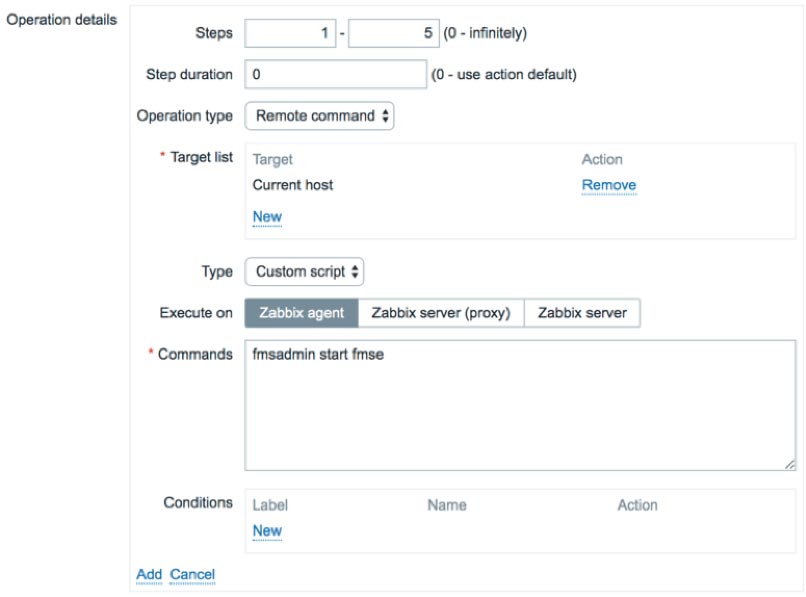
Click New to begin adding a new operation. Change the end step to 5 to indicate that you would like to try starting the script engine process up to five times. If the start command succeeds on the first try, the remaining four iterations of this step will be canceled. Change Operation type to Remote command. Click New next to Target list. Keep Current host selected as the Target and click the blue Add link to add the target. Enter the following command in the Commands field:
fmsadmin start fmseFull Paths on macOS
On macOS, you have to include the full path to fmsadmin since the Zabbix agent uses a different shell than macOS does. macOS uses bash as the default, and the Zabbix agent uses sh. The fmsadmin command is not registered in the shell, so it will not be accessible from any location like it is in bash.
Click the blue Add link to add the operation. Then click New to add another operation to send an email notification to accompany the first operation. Fill out the details similar to details shown in Figure 40.
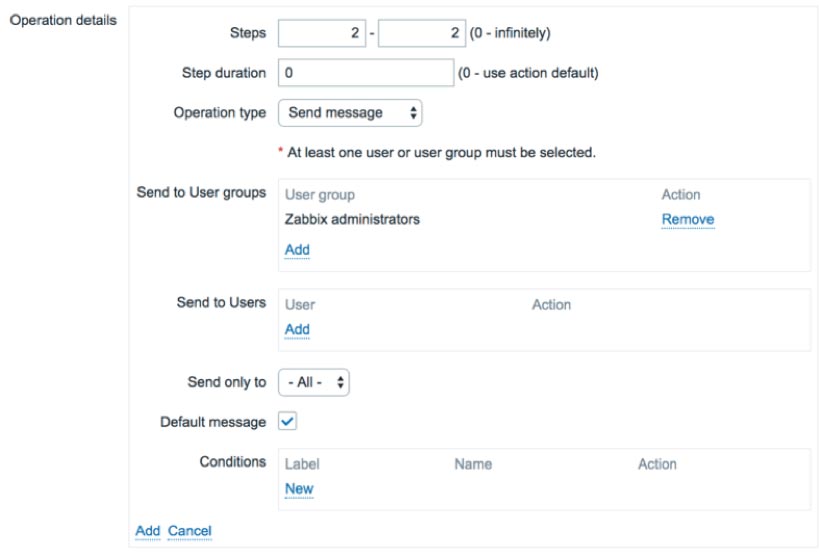
Once you click the blue Add link to add the second operation, the two operations should display as shown here:
Click the blue Add button to add the action.
Change the number of entries shown in a list
The Soliant Consulting template includes many items broken up into multiple pages when viewed in a list. To have them displayed on a single page, go to your user profile and change the Rows per page to a higher number; e.g., 200.
Securing Zabbix
If you haven’t already done so, change the default password used by the default Admin account. You can do so quickly by clicking on the person silhouette icon in the upper right and then clicking the Change password button.
Review the Zabbix documentation to see what other security measures make sense for your situation.
Download a DPF of this Post
Work with Zabbix FileMaker Server Experts
Would you like to set up Zabbix for your FileMaker solution but would like guidance? Our team has worked extensively with Zabbix, and we’re happy to help. Contact our team to get started.
Will there be a template for FMS on Linux?
Yes there will be.
Nice article! Would love to see the actiul FM 19 Ubuntu templates!
Nice article! Would love to see the actual FM 19 Ubuntu templates!
I second Fabian! Having virtually all of my servers now on Ubuntu, I’d be really grateful for the templates for that
We’re working on it – it’s largely all functional but we need to do a bit more testing.
Hi Wim, thanks for your conribution to the community.
I’ve been trying to get the current 2019 version working on Ubuntu without success.
Any idea of when you’ll have the FMS 19 Ubuntu template released?
Hi Daniel,
No ETA yet but it will be soon, we have an internal working version that we need to clean up.
Best regards,
Wim
Any chance of monitoring connection count to individual databases? Trying to track database usage.
The Access log has those details but it requires some post-processing to keep a count per file.
Similarly you can also get the info from the Admin API /clients endpoint. It will list each client and what files they have open.
Some items in the Windows xml file are “Not Supported”. For example the script is looking for wpe.log when the file is now wpe0.log
If you do make an updated file I would like to know! Thanks
Will do. We’ve been working on it for a while now so hopefully soon 🙂
Also note that if I do
fmsadmin stop fmdapi
Then the monitor for that becomes unkown rather than triggering. Here is an image showing what happens when I stop fmdapi. Before stopping it the trigger was enabled.
https://1drv.ms/i/s!AkzhXDS3CLCalrMlkAdryPjXXAFRDw?e=ghXS9V
Hello, there is a template for zabbix that works with FileMaker 20, the items tell me that they are not supported. Thank you
Not yet, no. It’s been on our to-do list for a while.
It’s an open source project – anyone can contribute 🙂