My colleague Brian Engert and I recently helped one of our clients prepare a plan for transitioning their deployment model to use the Data Migration Tool (DMT).
When it was released in 2018, Matt Hintz wrote about how this tool makes the job of deploying FileMaker database changes a lot easier.
During execution, the tool will operate on a single database file, migrating data from the production file into a clone of the development file. The resulting file then is a combination of the data from the production environment and the logic and schema from the development environment.
If the solution consists of multiple database files, the tool has to be run multiple times, once for each file. This can be done sequentially, waiting for the migration of one database to finish before starting the next one. But it is also possible to launch multiple concurrent DMT processes.
If it takes a relatively short amount of time to migrate data for your solution, then you don’t need to devote much energy to optimizing the migration component of your deployment. But as the size of the solution grows, the migration will take longer to complete – potentially as long as several hours. Many businesses can tolerate multiple hours of downtime every few weeks, in which case the impact of the long duration will be felt solely by the developer or the DevOps engineer performing the deployment. But some businesses operate around the clock and don’t have the luxury of being able to shut their systems down for extended periods of time.
One of our clients, who runs their business in multiple shifts around the clock, expressed an interest in transitioning their deployment model to incorporate the Data Migration Tool. Our client’s solution is comprised of nine database files whose combined size is 72 GB. Their approach thus far involved taking detailed notes on what changes were made in development, and then, during a deployment, following those notes to recreate those changes in the production environment. This deployment model is error-prone and very burdensome. These shortcomings could be removed by switching to the DMT.
Before switching to the new deployment model, we had to make sure it would satisfy these requirements:
- The data migration had to be as fast as possible because our client’s business operations dramatically slow down during a system outage.
- The outage duration had to be known ahead of time. This is a common requirement imposed by change management processes in larger organizations.
- The production server was not available for testing, so we could not use it to time the migration ahead of time. The duration of the migration is heavily dependant on the underlying hardware, but we did not have another machine available that matched our client’s production server specs.
To validate the decision to start using DMT, and to help plan for the change in the deployment model, we needed to answer the following questions:
- How long will it take for DMT to process the database files?
- Will it run faster if we run multiple DMT processes in parallel?
- What is the optimal number of concurrent DMT processes?
- What will be the bottleneck if we run multiple concurrent DMT processes?
Block Mode vs. Record Mode
When finding out how long it would take for DMT to process the database files, we needed to consider both best-case and worst-case scenarios. To construct these two test scenarios, we must understand how DMT operates at a more detailed level.
DMT performs its job by migrating record data one table at a time. It can do this in one of two modes. In the fast mode – called block mode – the tool moves data in blocks, with each block containing many records. In the slower record mode, data is moved one record at a time. As the tool moves from one table to the next, it determines which mode it needs to use for that table. The tool documentation does not list the kinds of development changes that cause a table to be migrated using the slower record mode, but here is a partial list based on our testing:
| Target of Dev Change | Add | Modify | Delete |
|---|---|---|---|
| Normal (non-calculation) field | Block | Block | Record |
| Unstored calculation field | Block | Block | Block |
| Stored calculation field | Record | Record | Record |
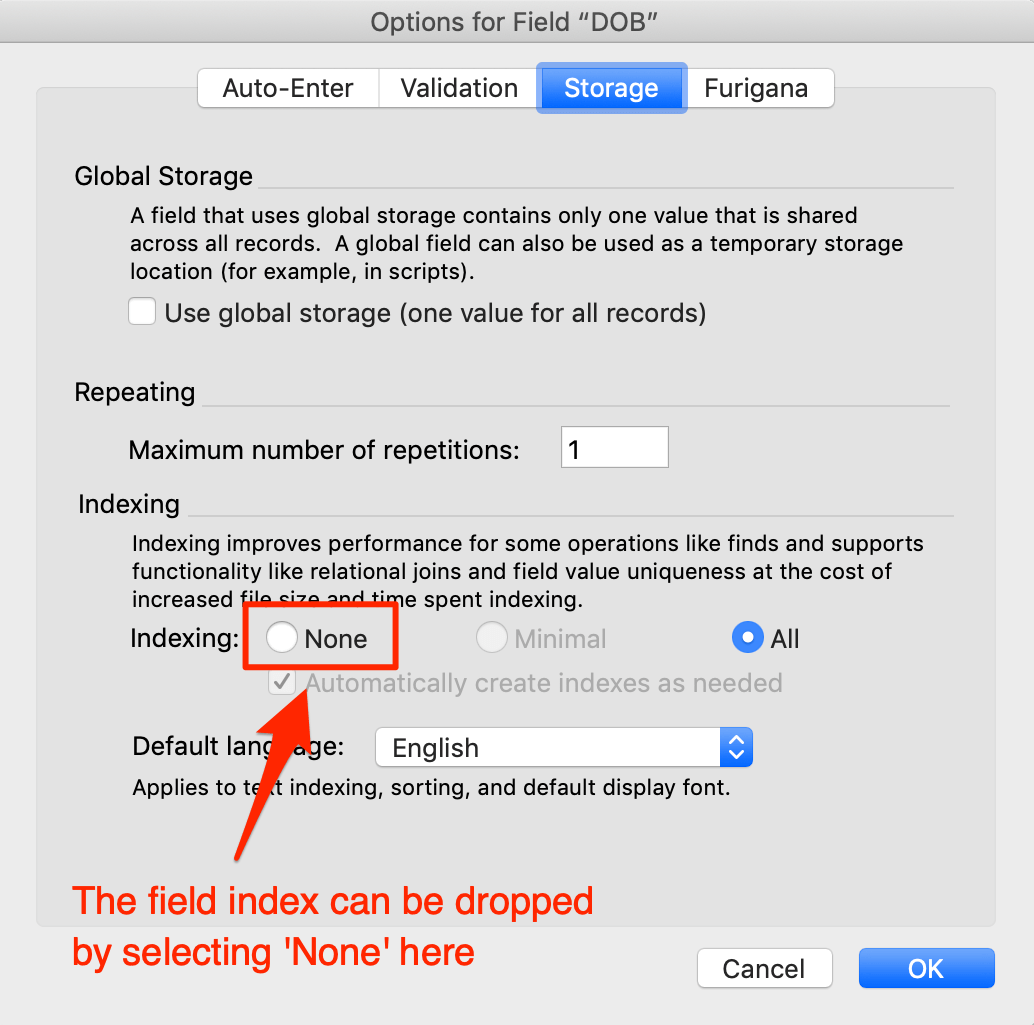
| Field index | Record | Record | Record |
For our testing, determining the best case is straightforward: we need to have all of the tables migrate using block mode. The simplest way to do this is to use a clone of the production file itself. This ensures that there are no development changes in the clone.
Determining the worst case is more complicated. Upon initial reflection, we might think that the worst case would involve having every table run in record mode. But can there be variation in how long it takes for a table to be migrated using record mode, or are all record mode migrations the same? As it turns out, what happens during a record mode migration matters. When DMT uses record mode for a particular table, it is because there are additional operations that need to happen with at least one field in that table. For example, this could involve updating a stored calculation field or copying or rebuilding a field index. Each of these operations takes time. So the more fields there are that require special treatment, the longer it will take for record mode migration to complete for that table. Therefore the absolute worst case would be that, in every table, every stored calculation field needs to be updated, every field index needs to be rebuilt, etc.
This is not a realistic situation however, since in a typical deployment, only a subset of fields will be modified in any given table. In our case, the nine files have 453 tables altogether, but most of those tables haven’t been changed in a long time. So to construct our worst case, we honed in on the 43 tables whose schema we knew was modified at some point over the past three years. We then forced these tables to migrate using record mode. This could be done by taking any of the actions listed above (for example, modify a stored calculation field). We chose to drop an index in a single field in each of those 43 tables because this was a very quick change to make.
In a typical deployment, we would likely be modifying more than just one field in a table, and the types of changes we would be making would go beyond just dropping field indexes. But those changes would also be constrained to far fewer tables than the 43-table set we tested with here. As a result, we felt comfortable that this approach represented a reasonably realistic worst case for our situation.
Test Environment
The duration of a migration depends on the machine that DMT is running on. Faster processors and faster disk can speed up the migration.
Because our client’s production server was not available to us to use for testing, and because our client did not have another machine available that matched our client’s production server specs, we turned to AWS to create an instance that matched our production server as closely as possible.
| Production Server VM Specs | AWS Test Server Specs | |
|---|---|---|
| Instance | N/A | m5ad2.xlarge |
| Processor |
|
|
| Memory | 32 GB | 32 GB |
| Storage | SSD |
|
Our test server used the M instance type, which provides fixed CPU performance. This is in contrast to some of the other types (such as the T type), which provide burstable performance where the server operates at a baseline level of CPU and is able to burst above that but only for a short amount of time.
For storage, we wanted to test out two options. The first option is the NVMe SSD local storage that is physically attached to the host. The second option is the EBS storage which is burstable and is the type of storage that is more commonly used for FileMaker server hosting.
The first storage option is much faster than the second, especially after the second option’s burst credits are used up, as they would be during a sustained operation such as a DMT migration.
We wanted to see how the various storage types compared, to see how closely we were approximating the production environment. We made our comparisons by measuring throughput and IOPS using the free CrystalDiskMark disk benchmark tool.
We performed the RND4K Q1T1 (random 4K bytes per operation, 1 item/queue, 1 thread) test because we reasoned that DMT would perform semi-random IOPS when running in record mode.
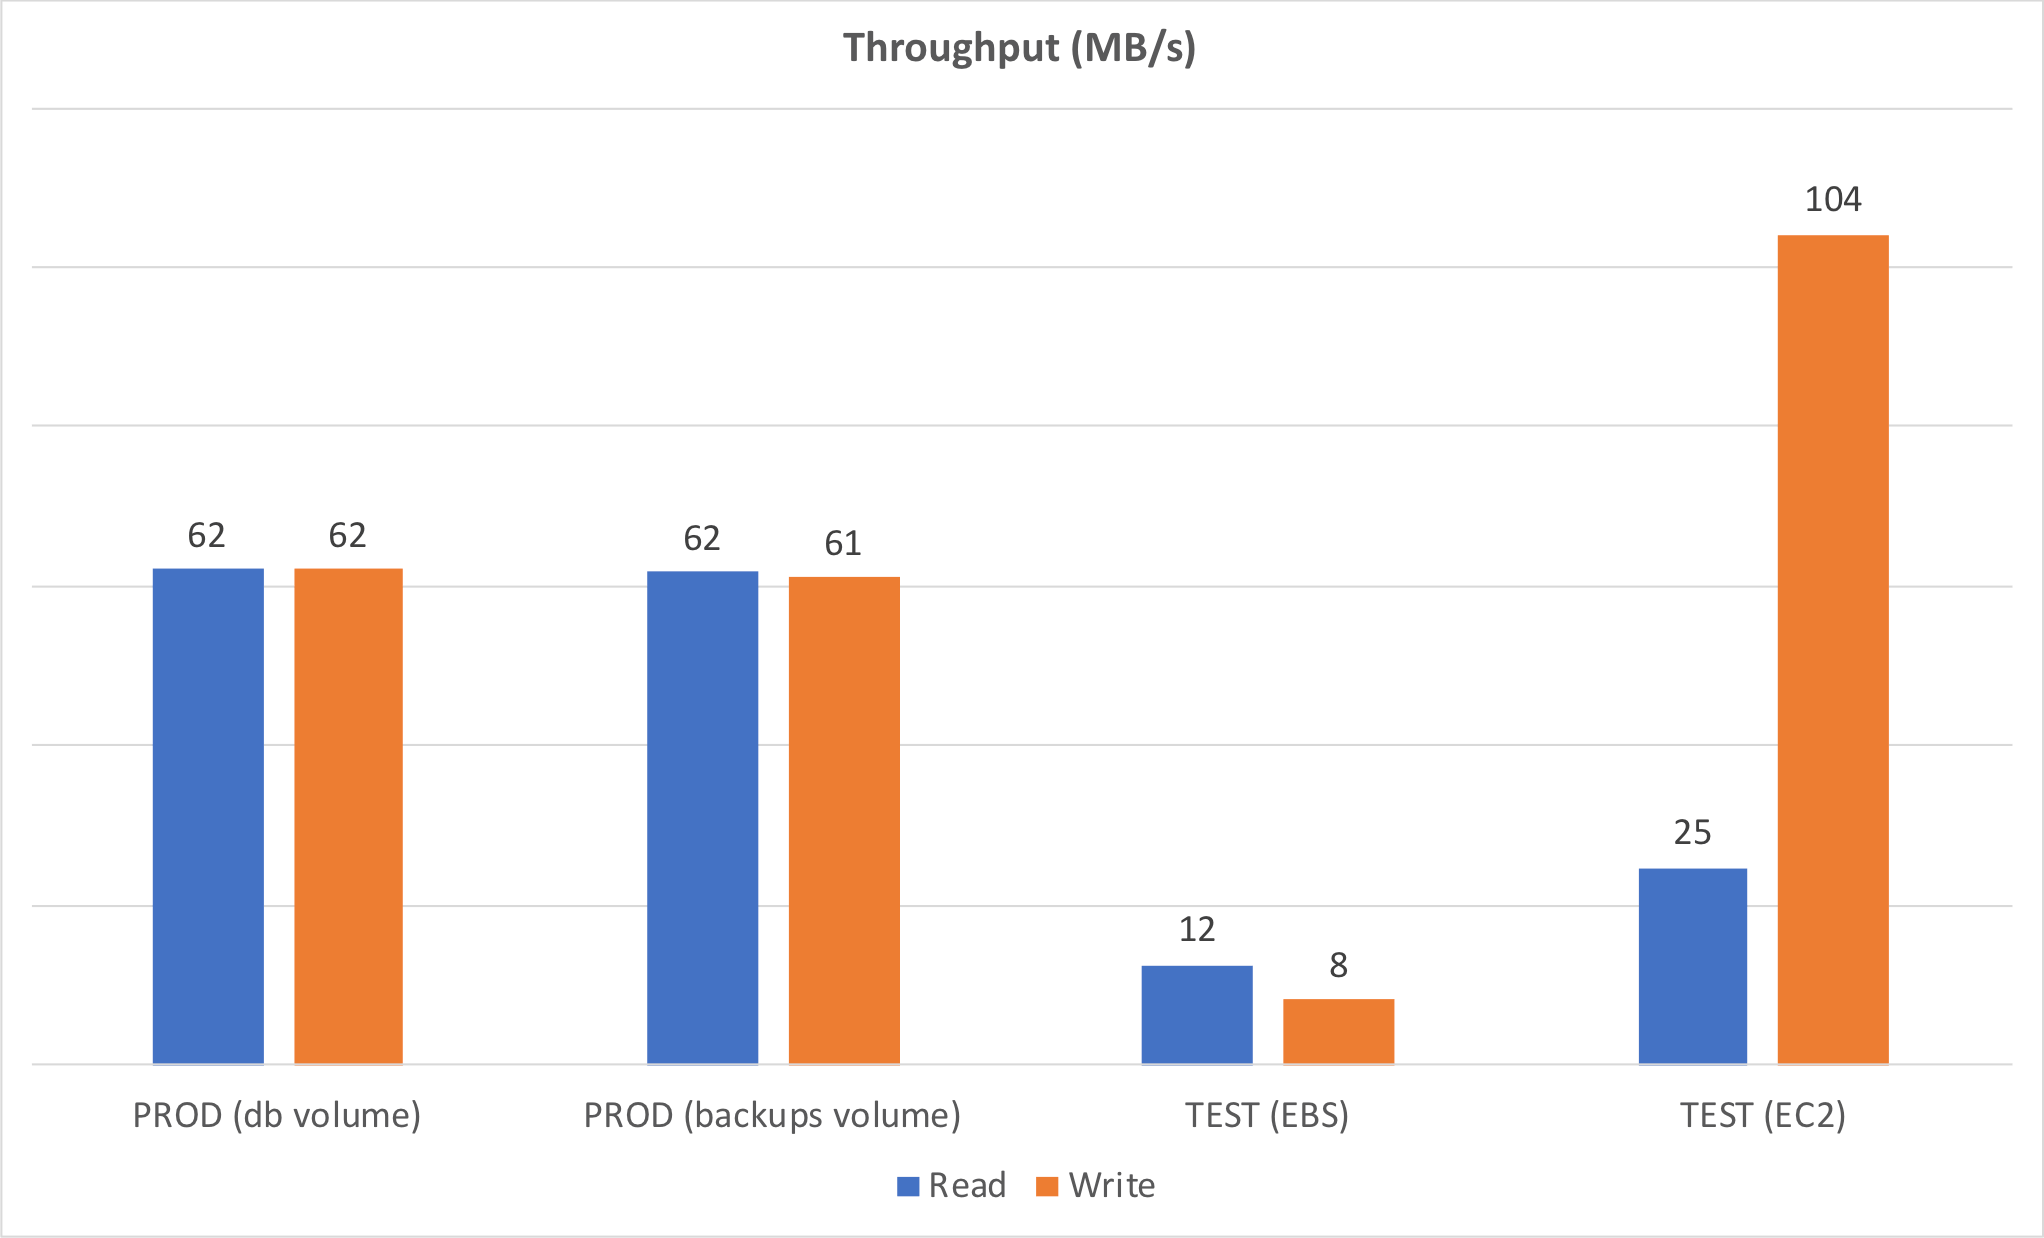
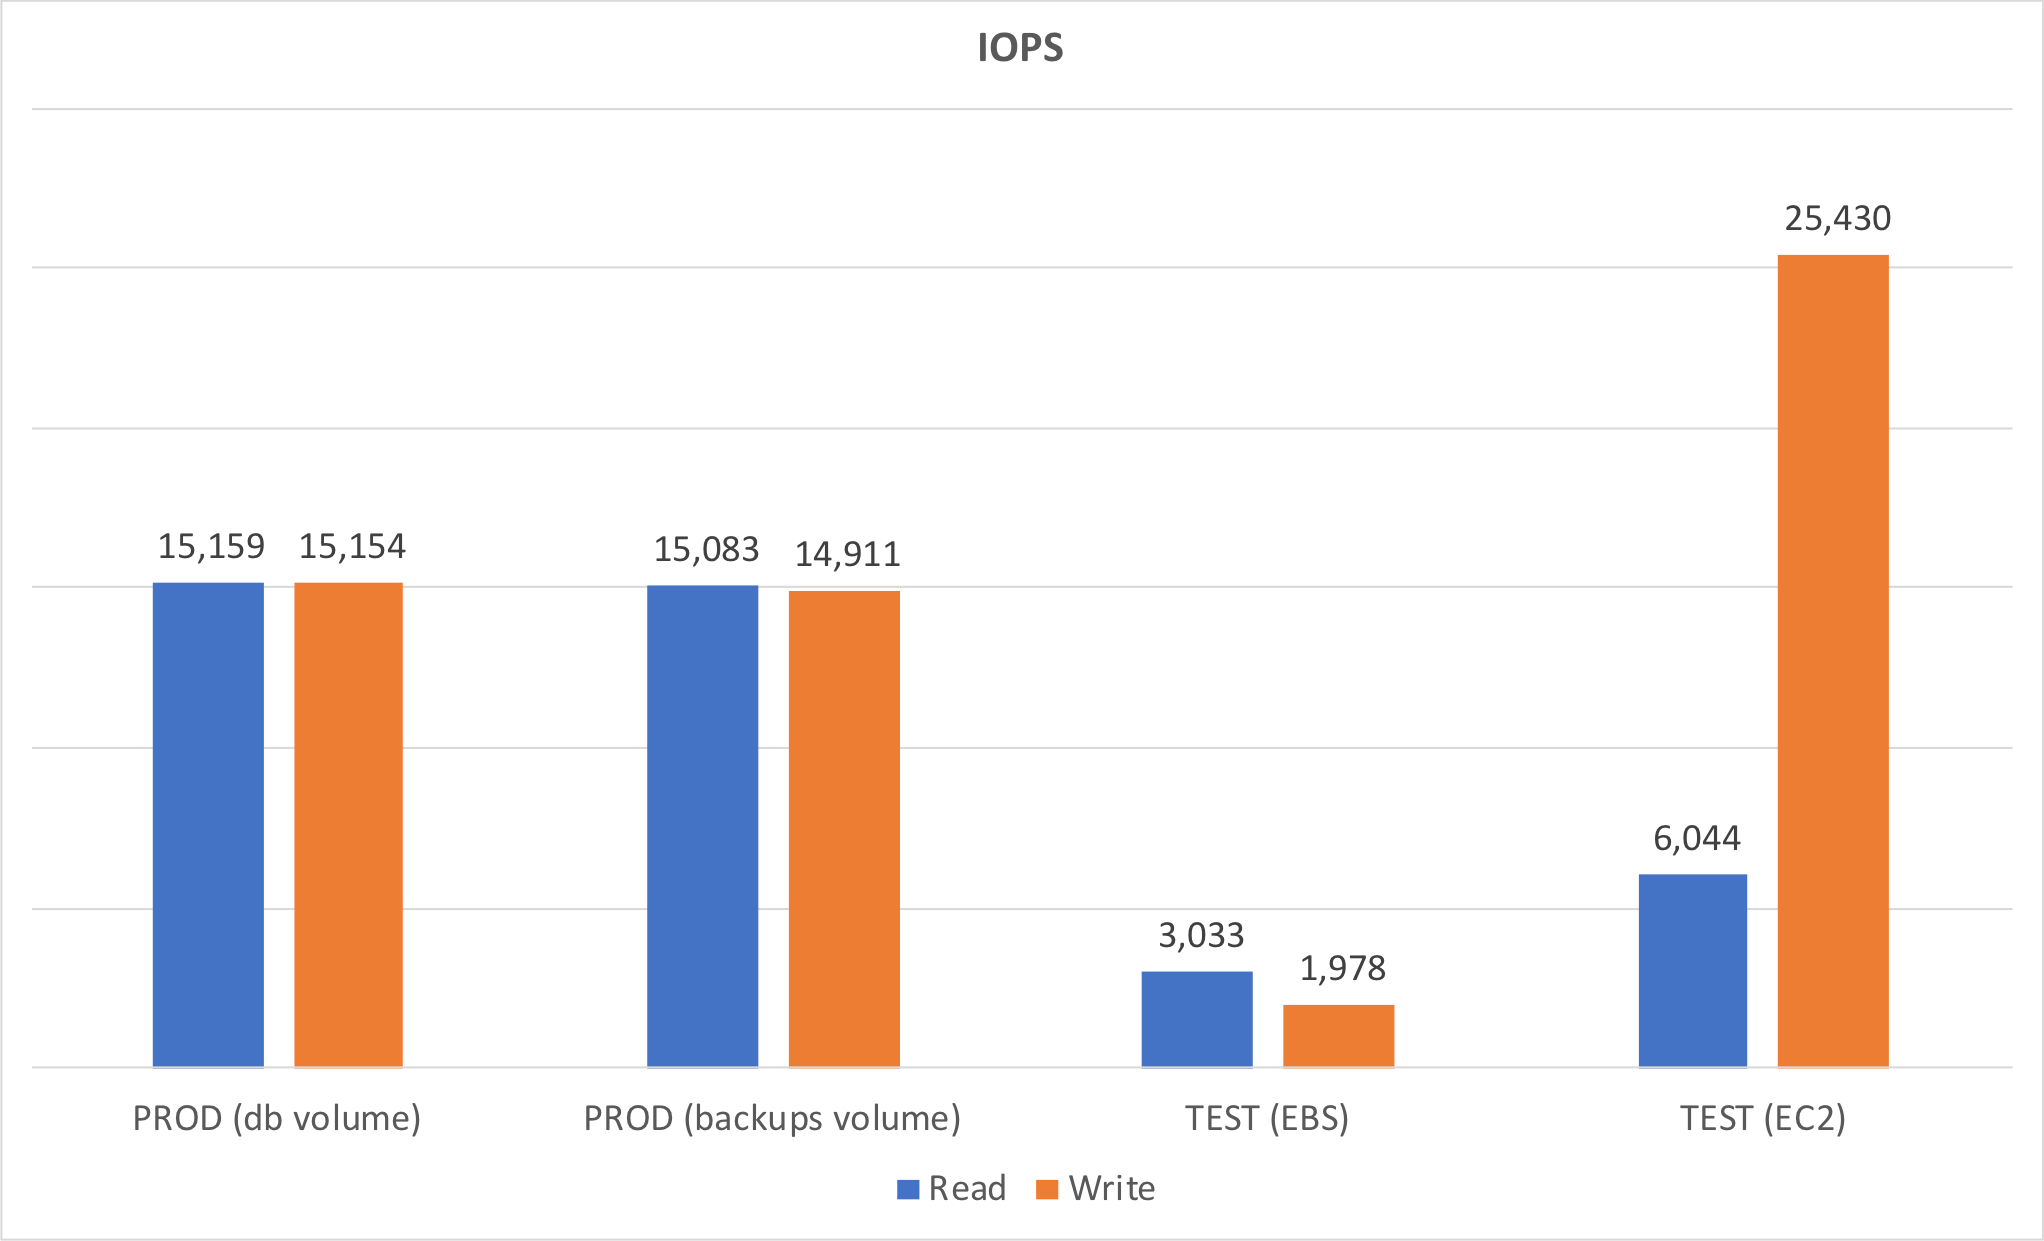
These results made it clear that our storage test environment did not perfectly match our production environment, but this was close as we could make it.
Database Files
Our client’s solution consists of nine database files. The combined total file size is 72 GB. Here’s how the individual file sizes compare to each other.
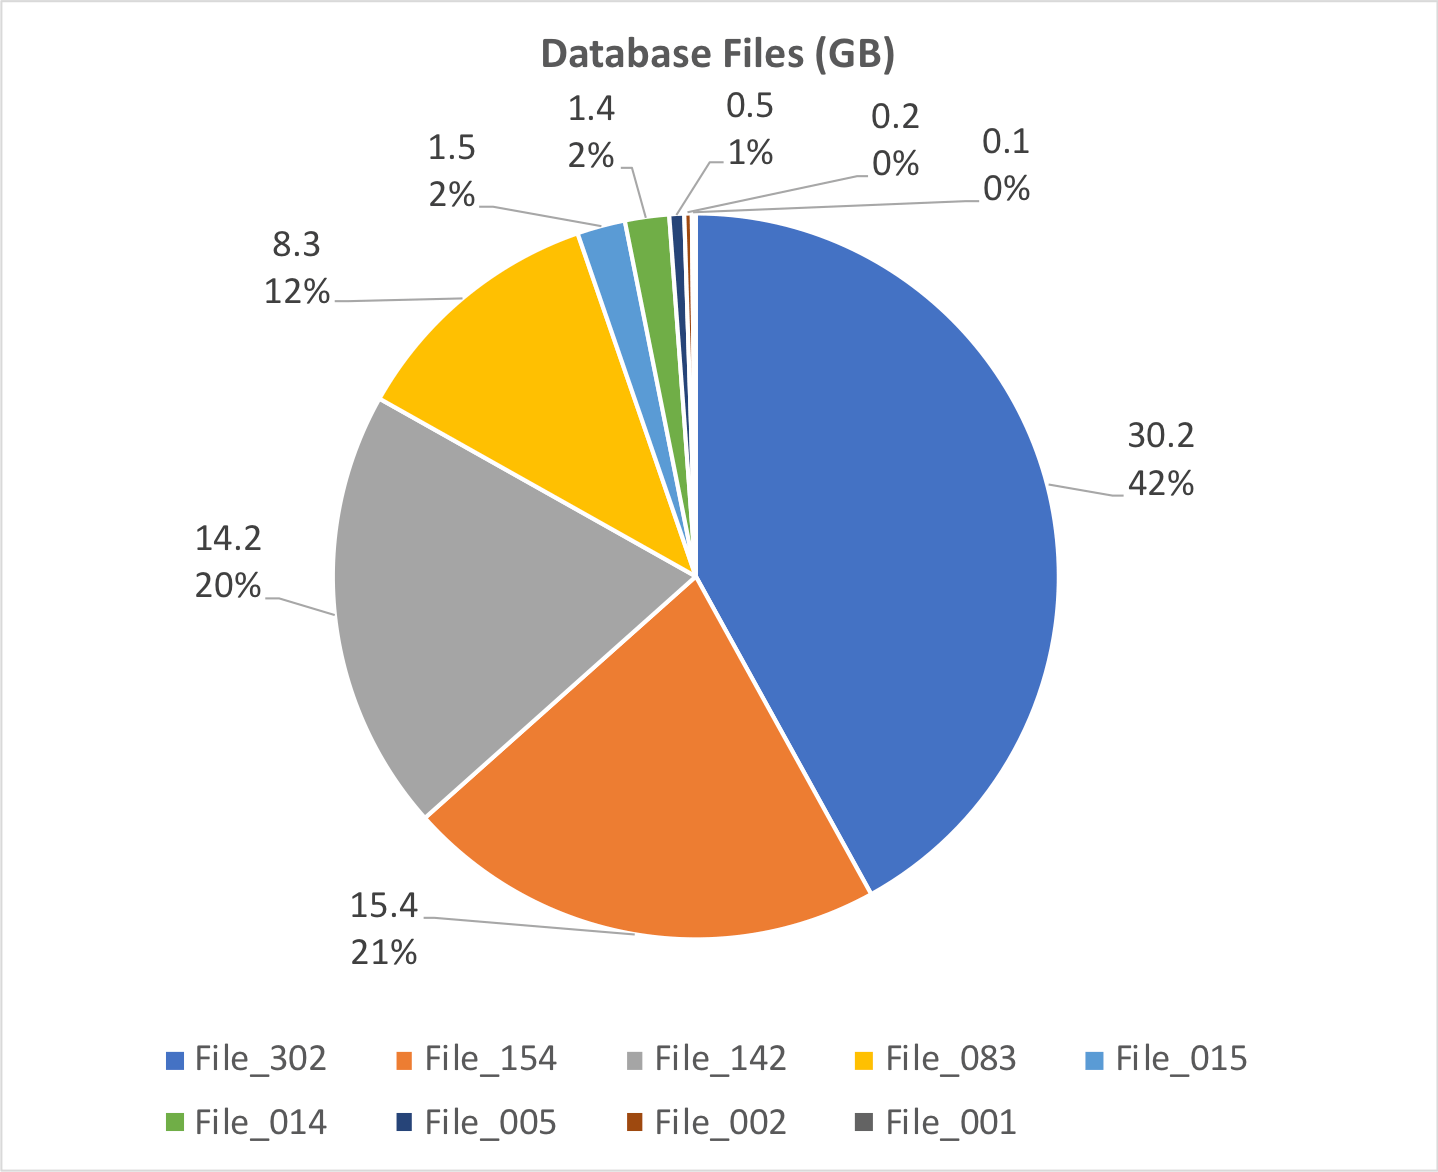
This is far from an even distribution in terms of file size. The largest file represents 42% of the overall size, and the smallest five files are about 5%.
Test Scenarios
We ended up running these 8 tests:
| Test # | Concurrent DMT Processes | Dev Changes | Storage |
|---|---|---|---|
| 1 | 1 | No | NVME |
| 2 | 2 | NO | NVMe |
| 3 | 3 | Yes | NVMe |
| 4 | 1 | Yes | NVME |
| 5 | 2 | Yes | NVMe |
| 6 | 3 | Yes | NVMe |
| 7 | 1 | No | EBS |
| 8 | 2 | No | EBS |
Duration vs. File Size
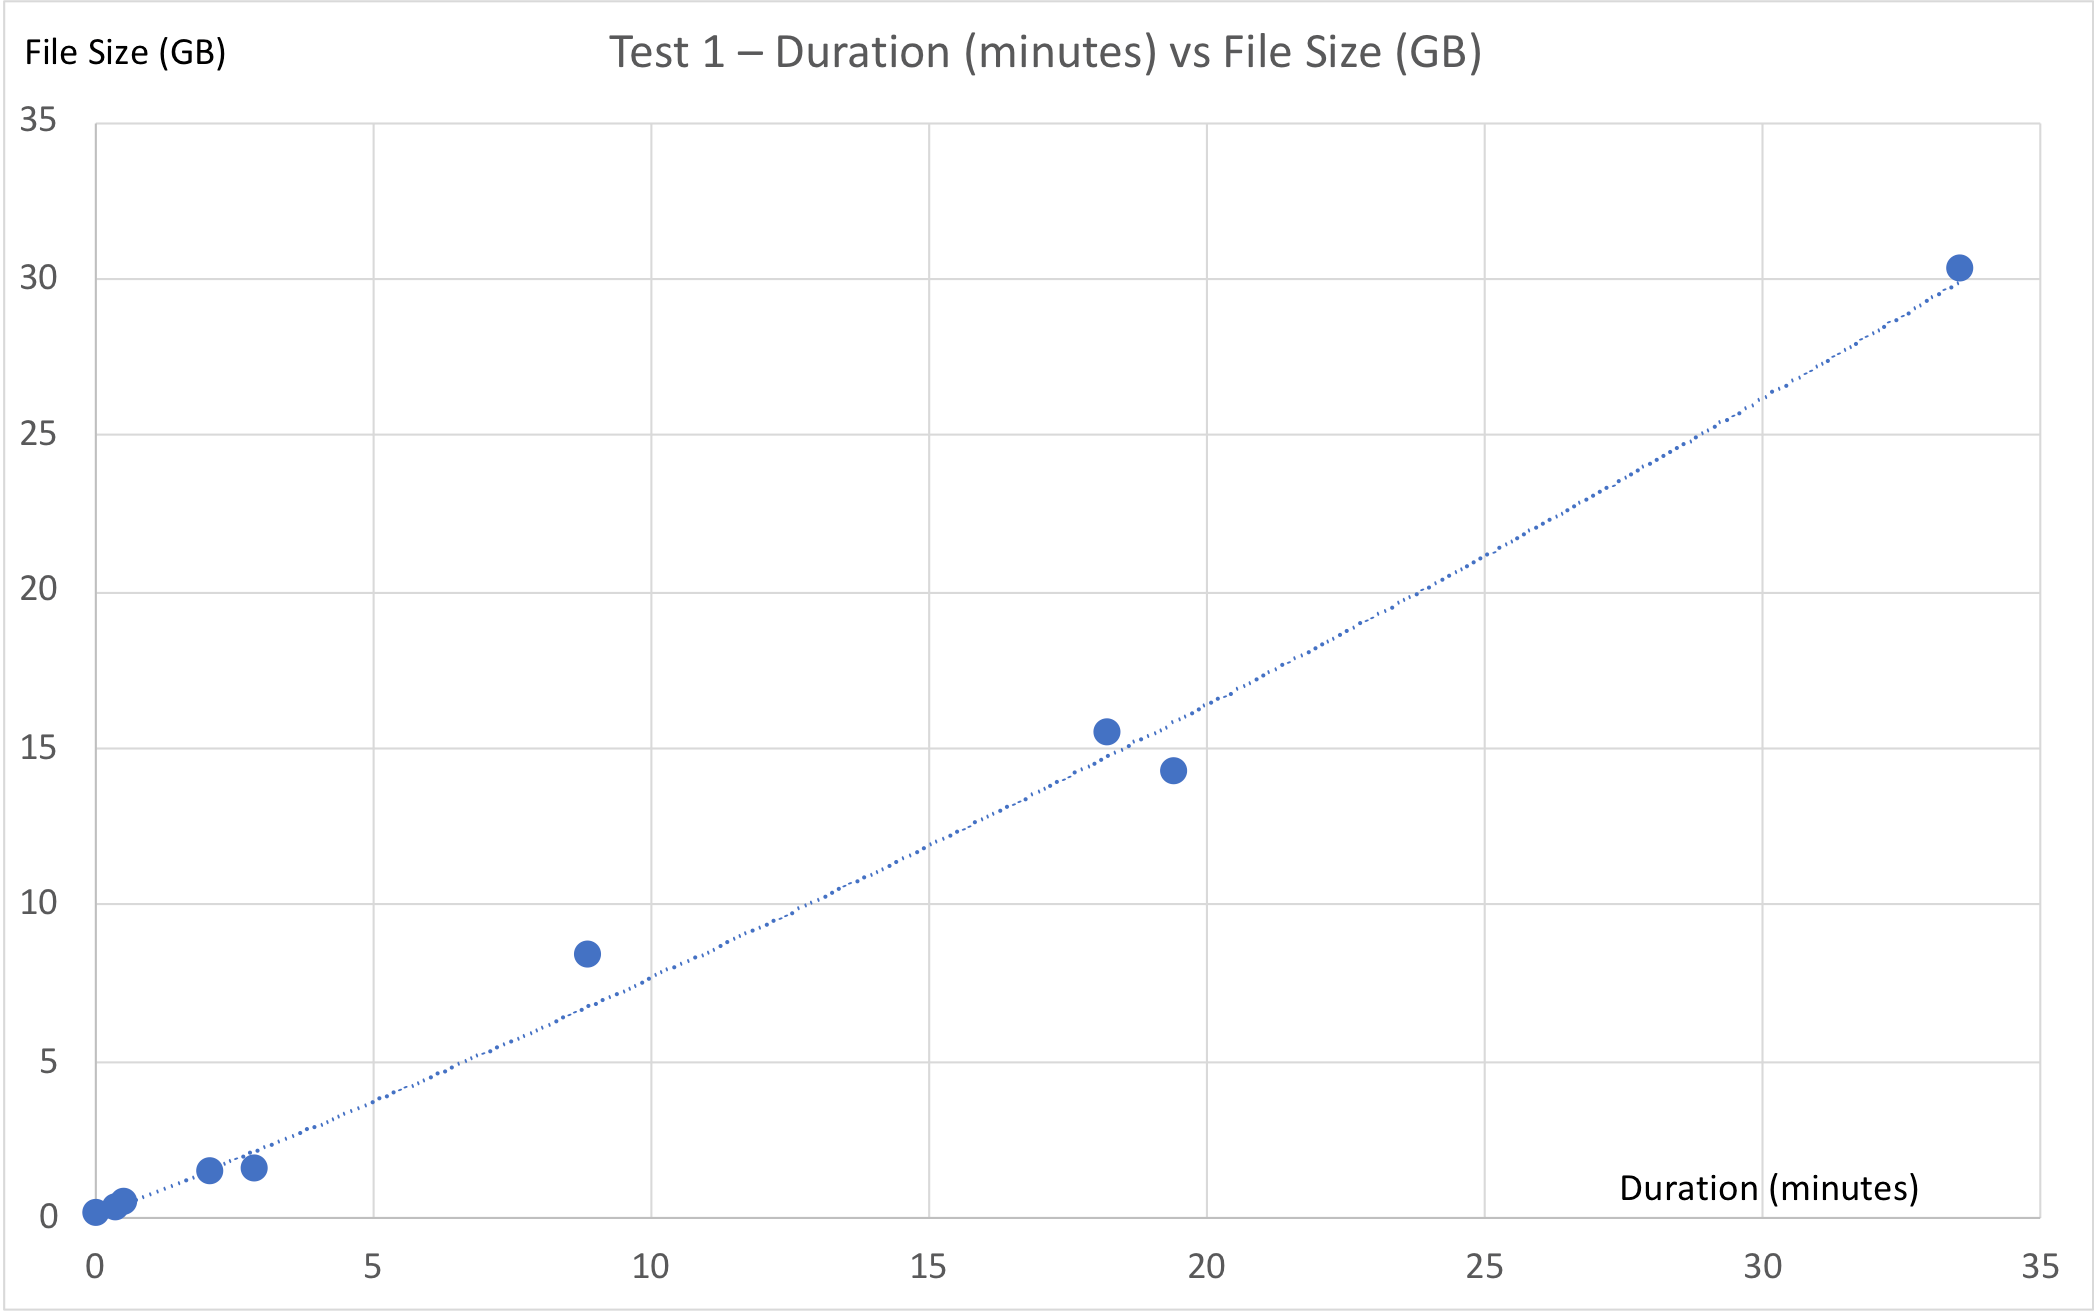
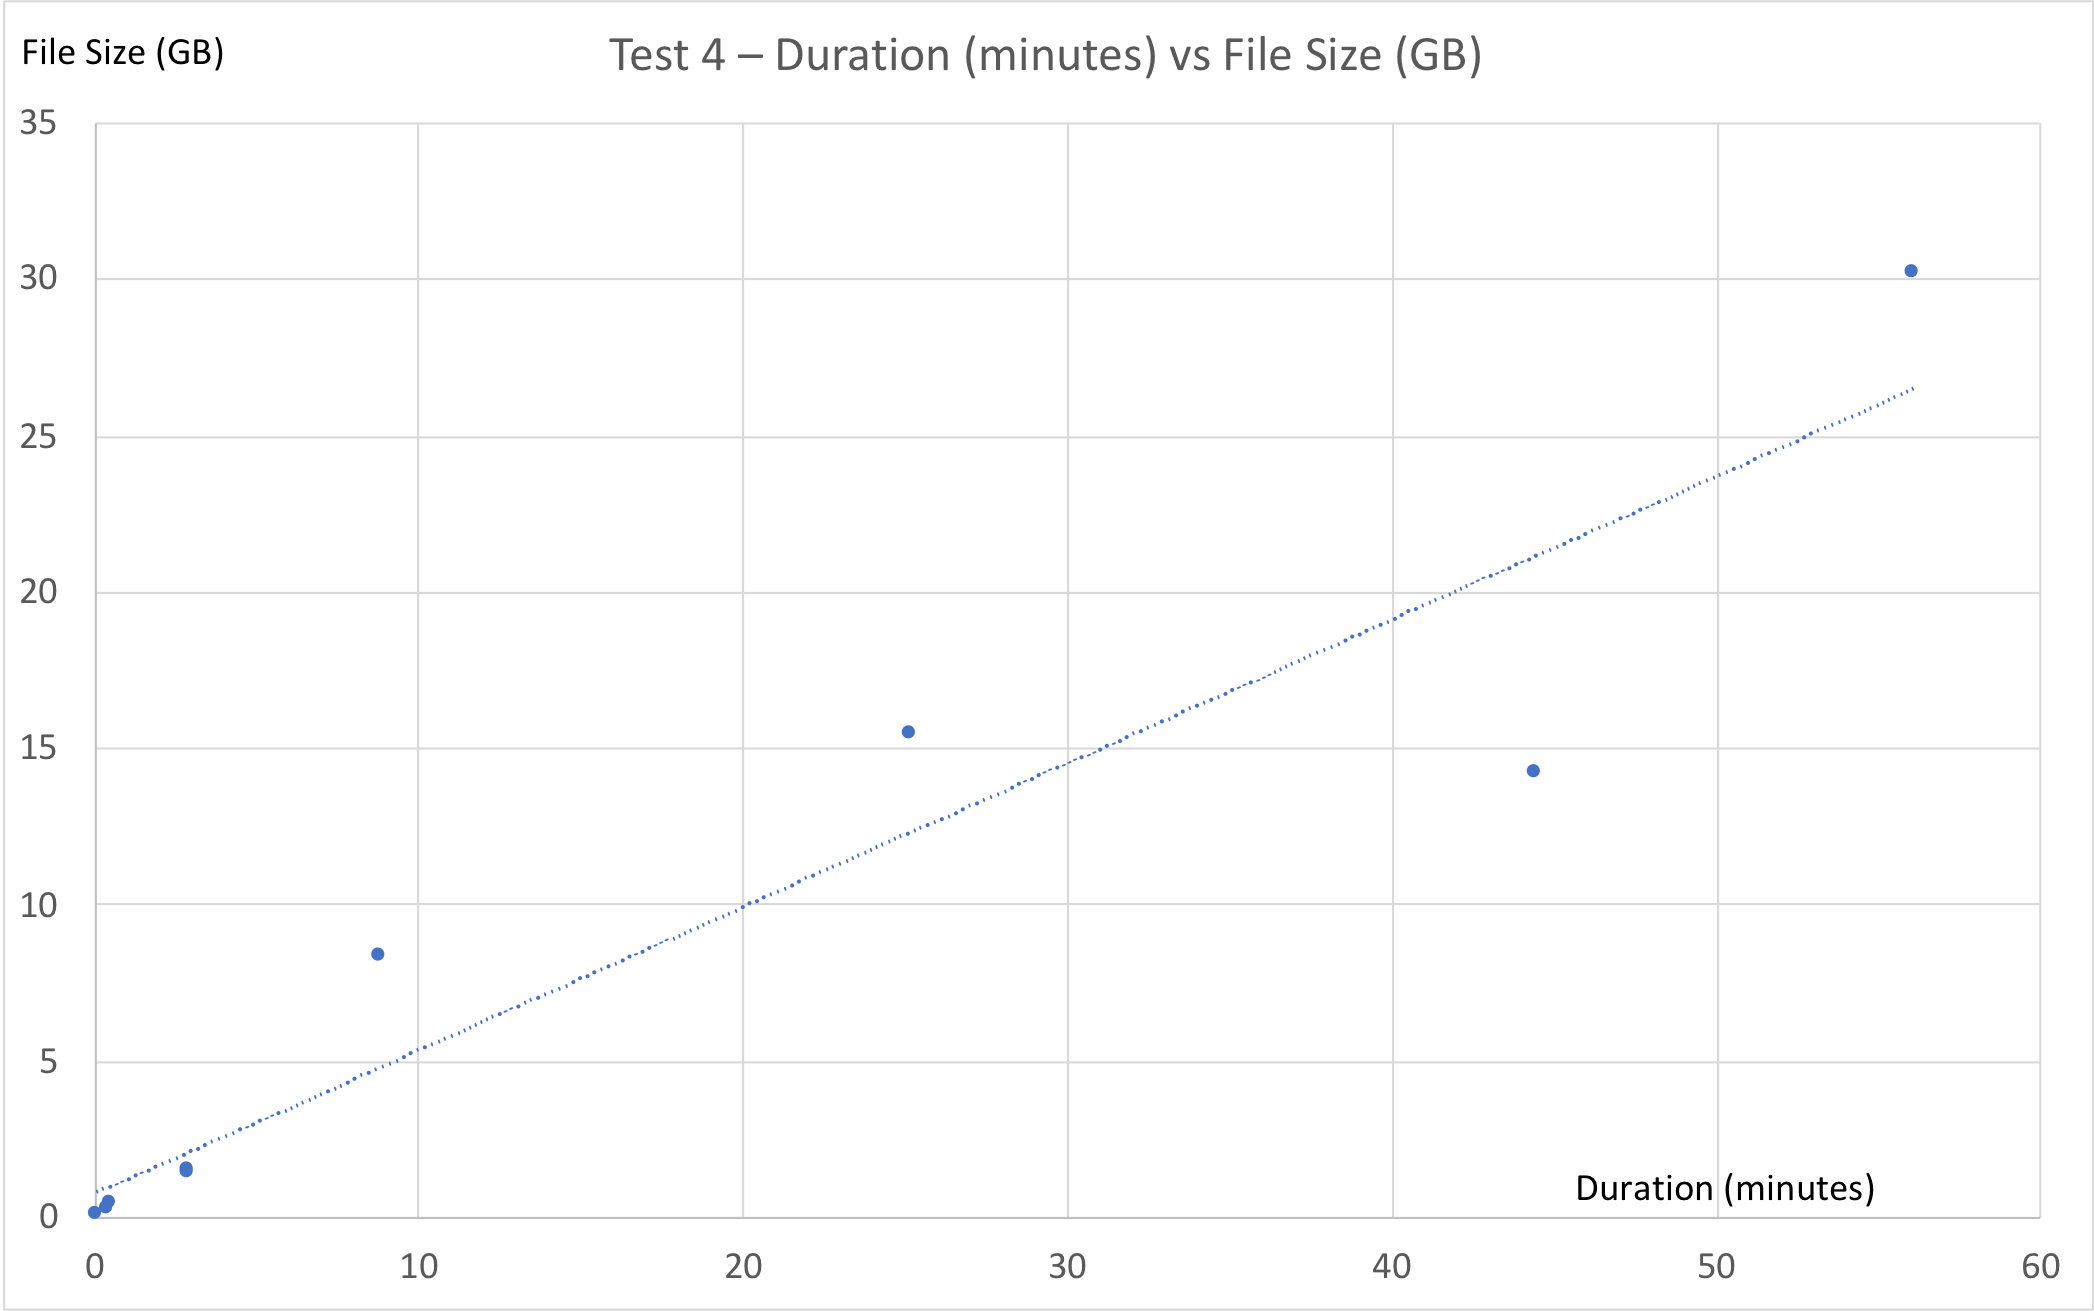
Based on the data from tests 1 and 4, we can see that there is roughly a linear relationship between file size and DMT duration. As the file size grows, the migration takes longer, but that increase grows linearly.
Concurrent DMT Processes
Let’s take a look at the first three tests. DMT was run nine times during each test – once for each database file – but in the second and third tests, the DMT processes were organized into multiple streams, so that at any given time there were two and three (respectively) processes running concurrently.
The files were processed in an order determined by their file size, with the largest file being migrated first. For tests 2 and 3, even though there was a highly uneven distribution in terms of file sizes, the files ended up getting split up into buckets of mostly equal size.
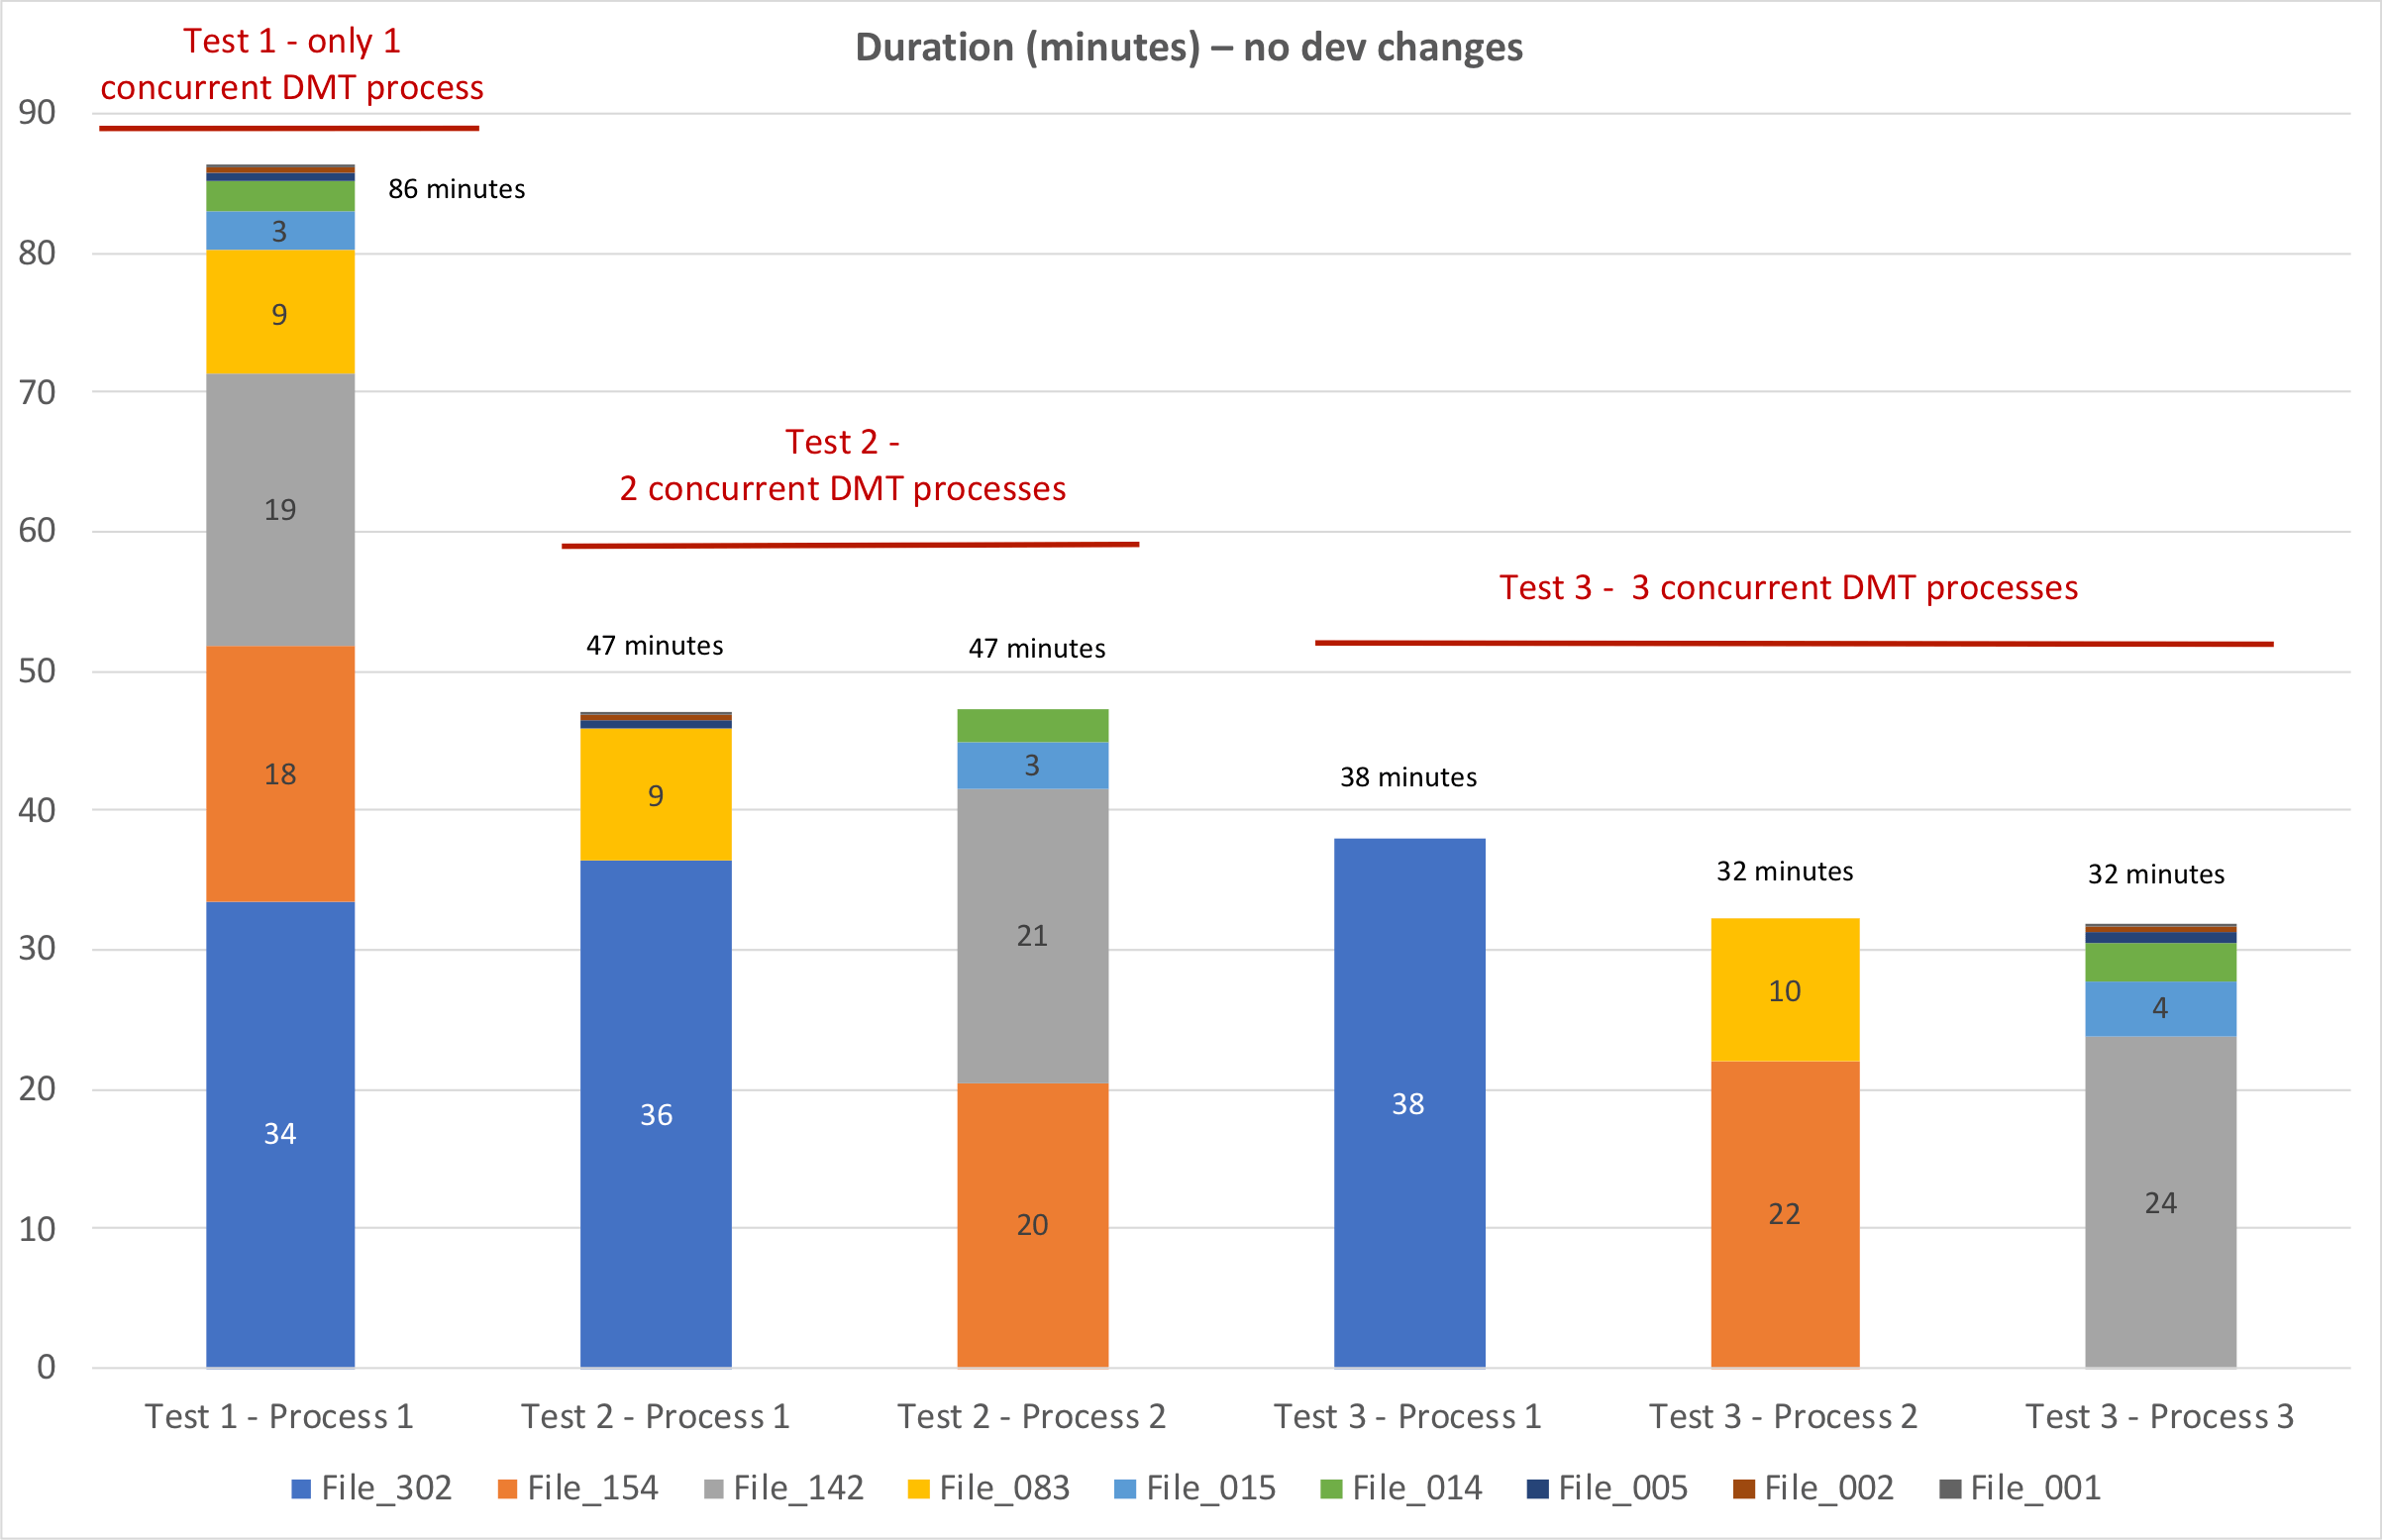
As a whole, the nine database files were migrated faster when we ran multiple concurrent DMT processes.
But once we reached three concurrent processes, the largest file became the bottleneck. Organizing the DMT processes into four streams wouldn’t have gained us any time since the largest file was taking longer to process than either of the other two streams.
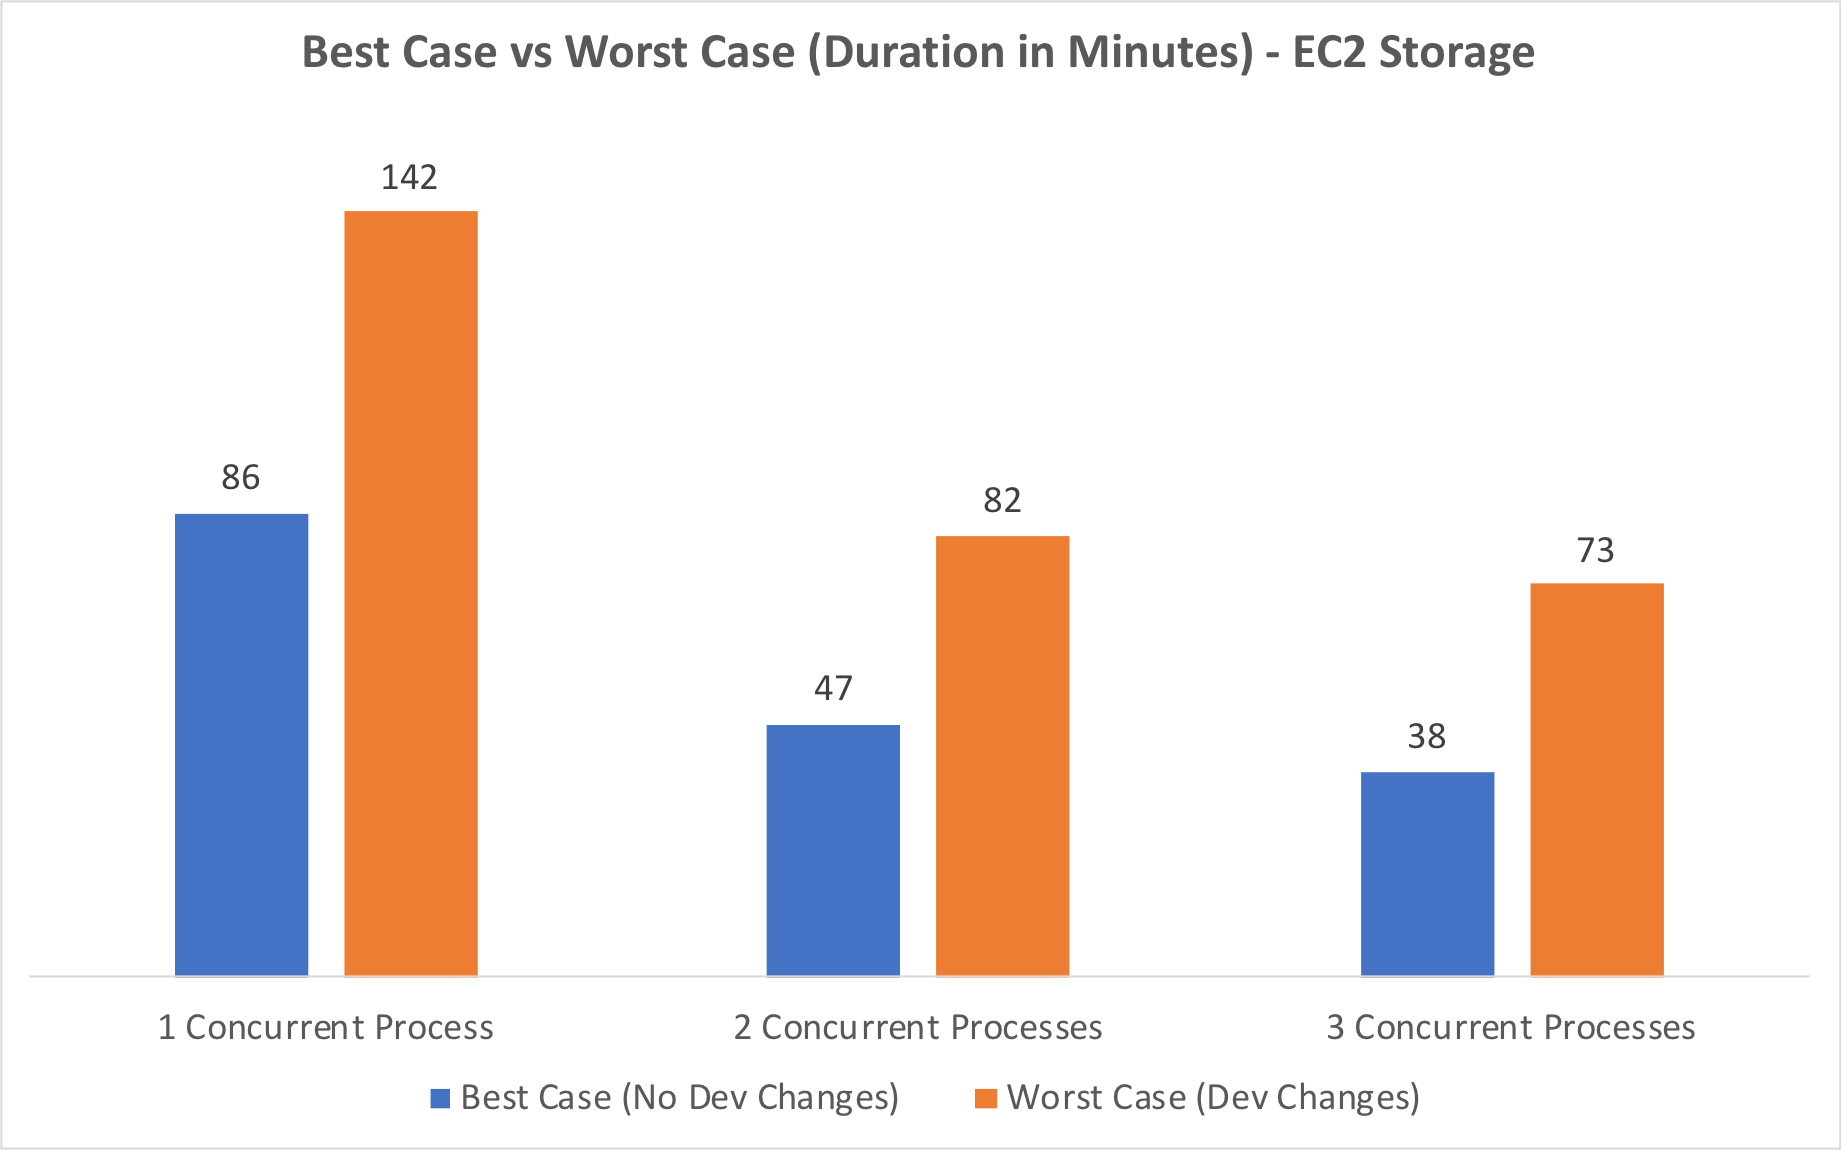
Worst Case
The first three tests were done using our best-case scenario – no dev changes in the clone files. The second batch of tests (tests 4-6) involved dropping the field indexes in 43 tables to force them to run in record mode. This caused the migration to run quite a bit longer, but even so, our 3-process worst case (test 6, 73 minutes) was still faster than our 1-process best case (test 1, 86 minutes).
Hardware Resource Utilization
We used Zabbix to monitor the server while running our tests. This made it easy to collect and review the utilization of the various hardware resources (processor, memory, etc.).
Let’s look at the processor, memory, and disk charts for the first six tests.
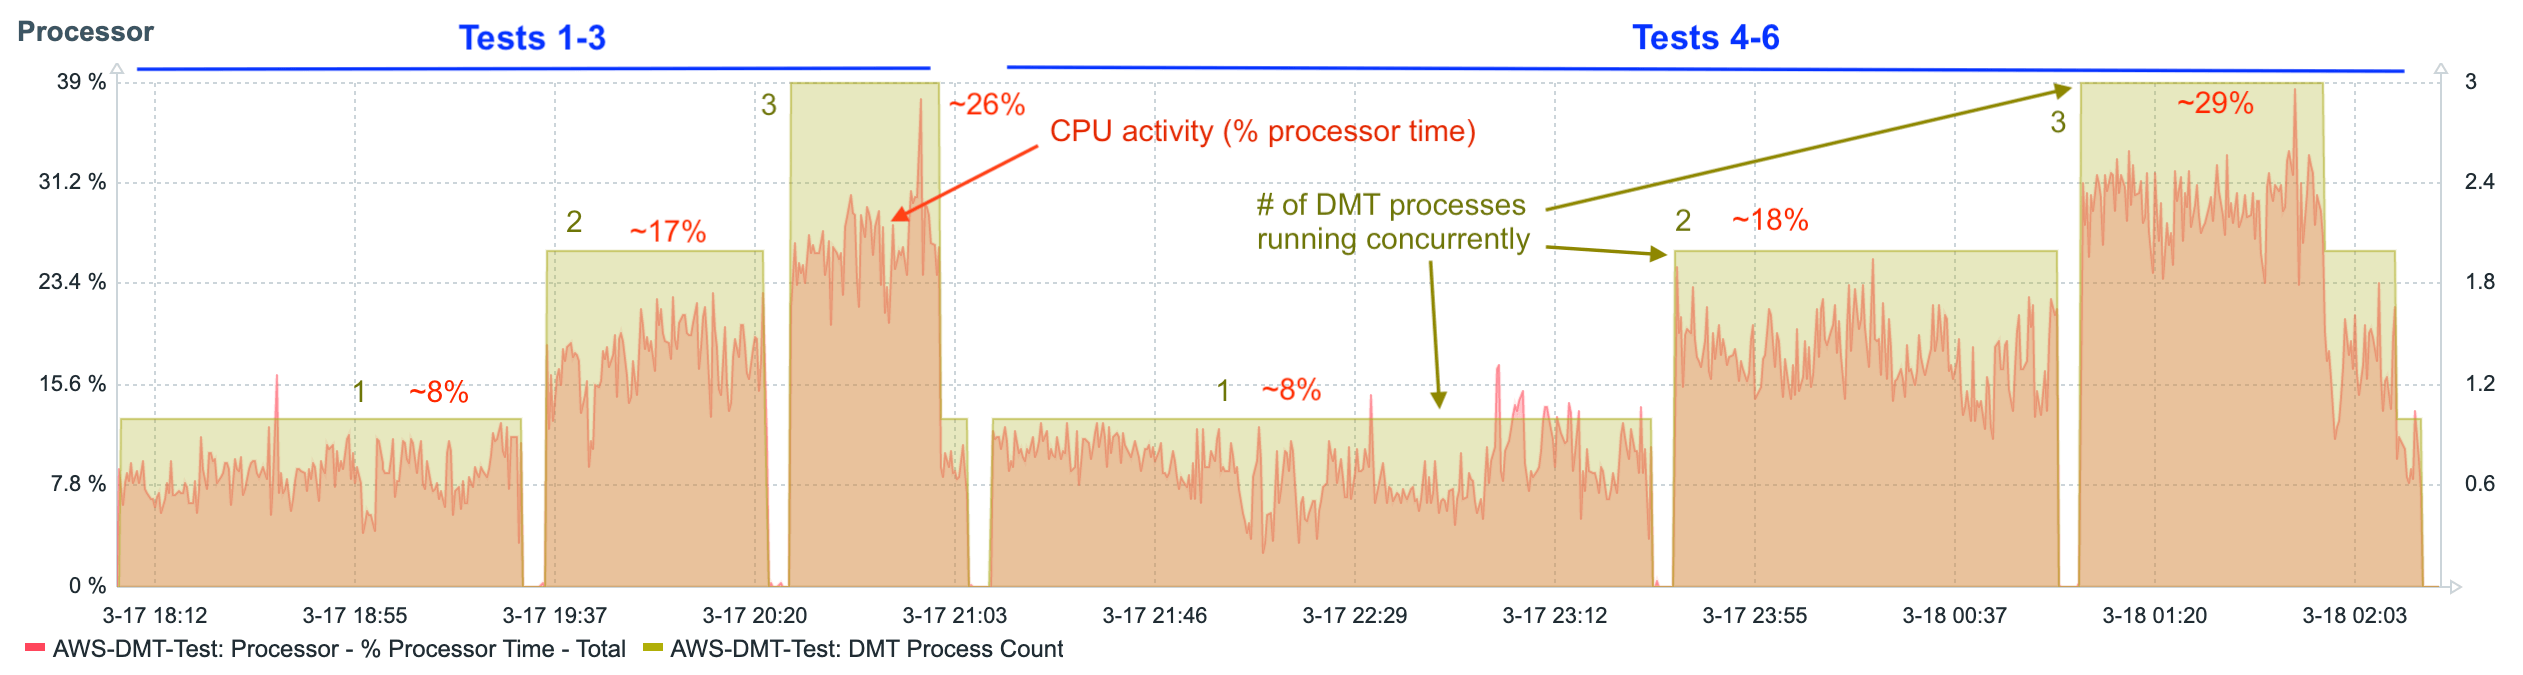
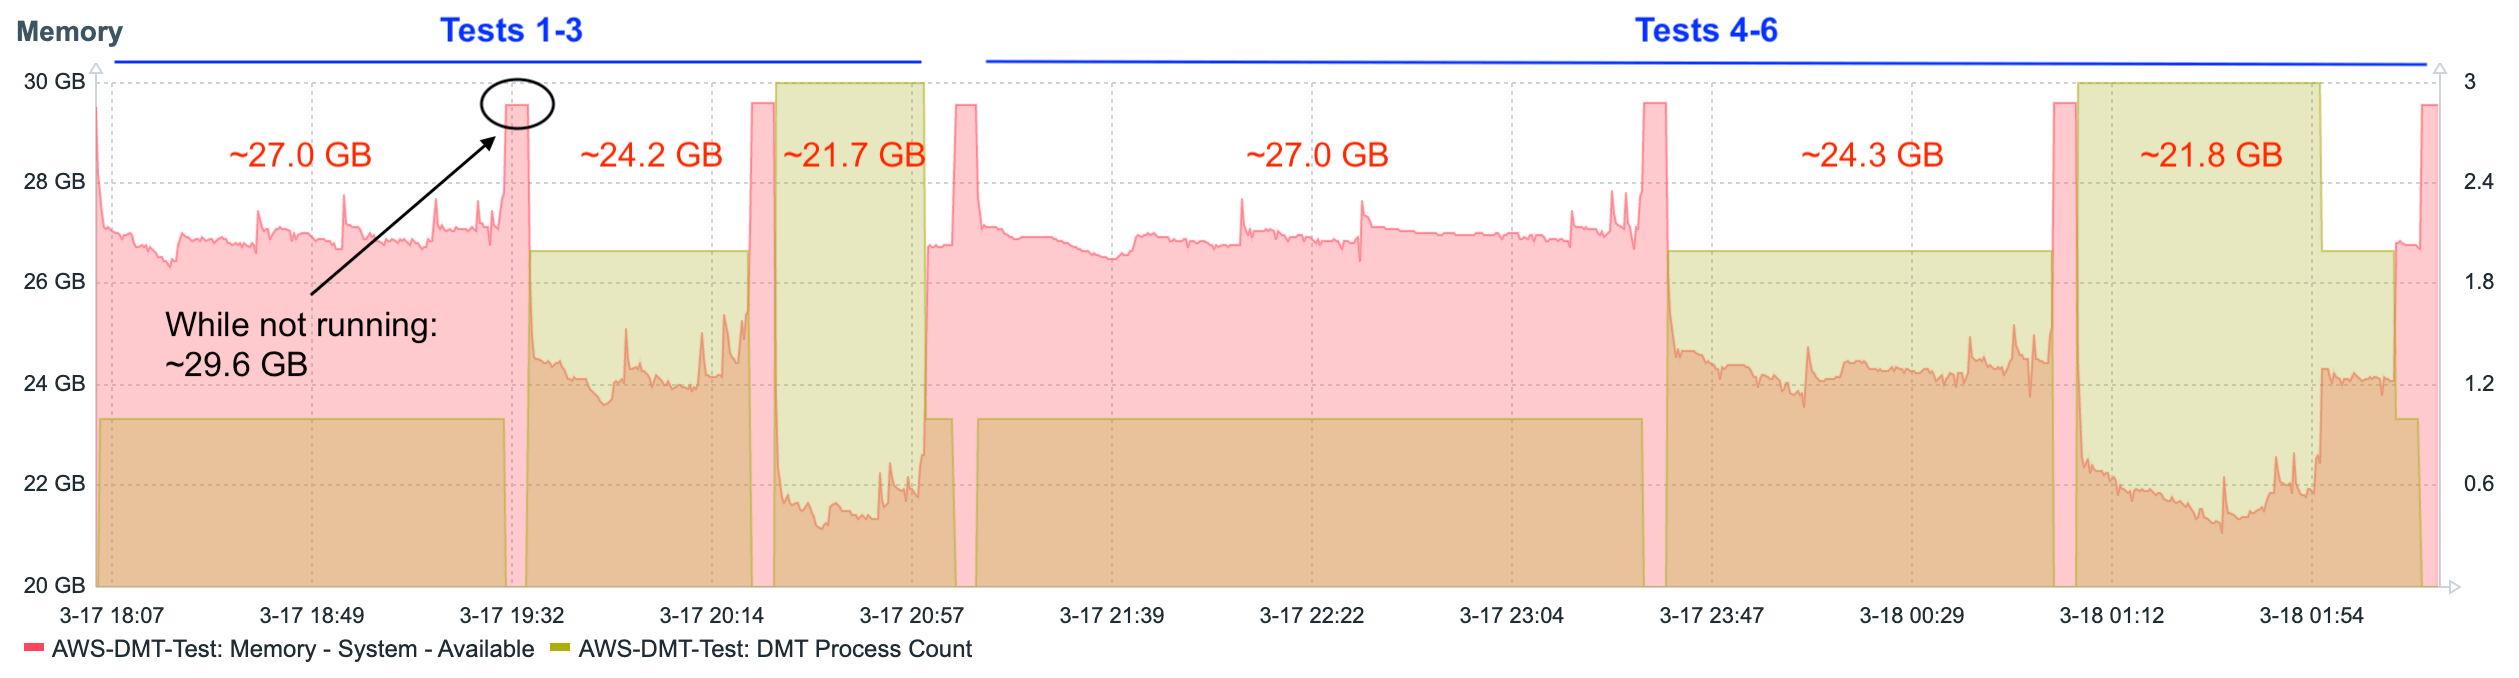
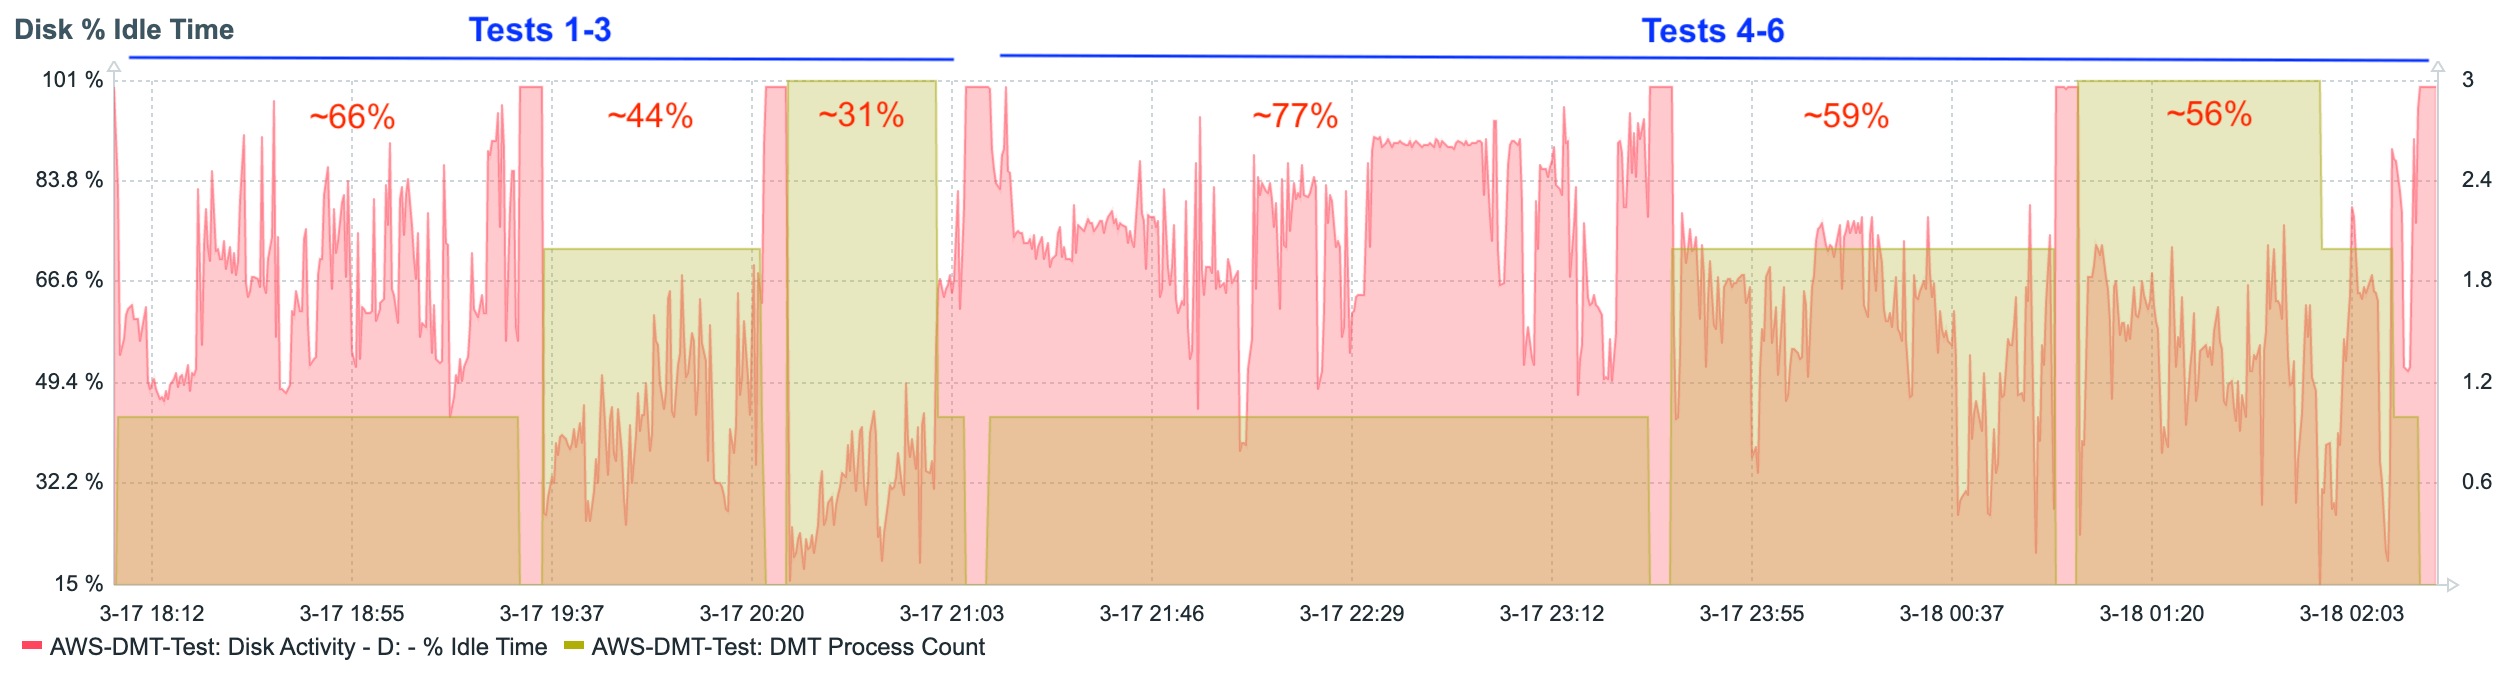

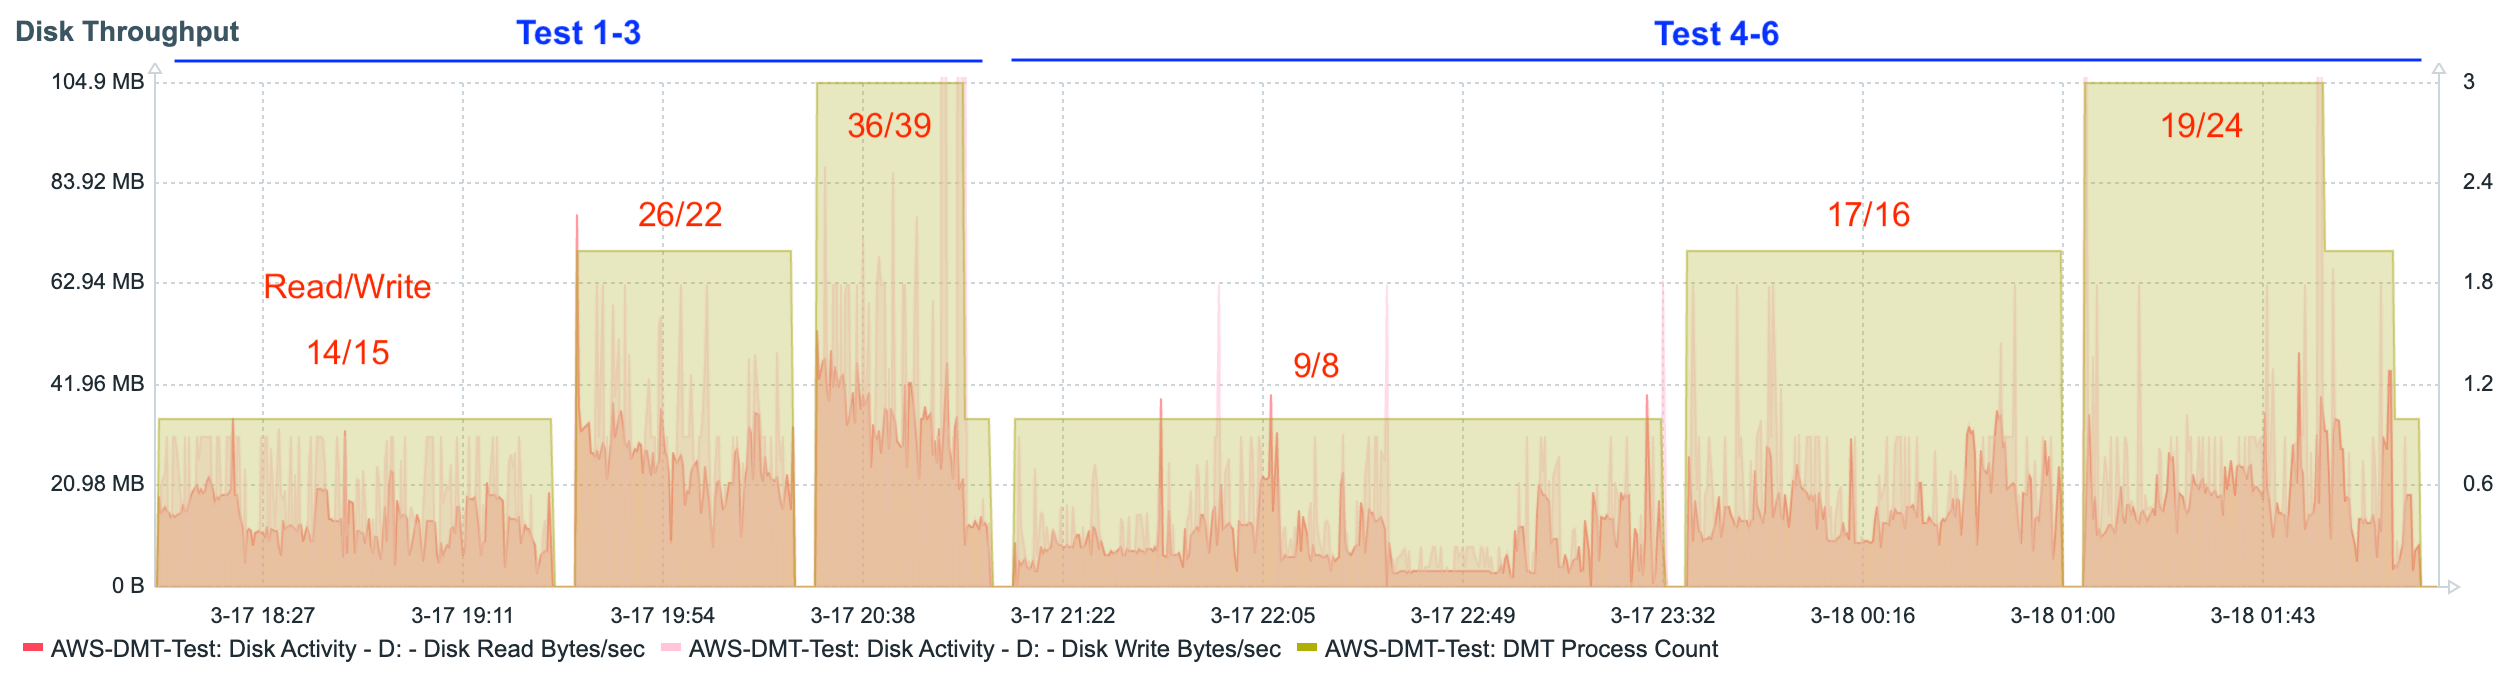
The data shows a fairly steady linear increase in the consumption of resources as additional concurrent DMT processes are added. This is even more apparent when looking at graphs that show the data from each test summarized as a single average value.
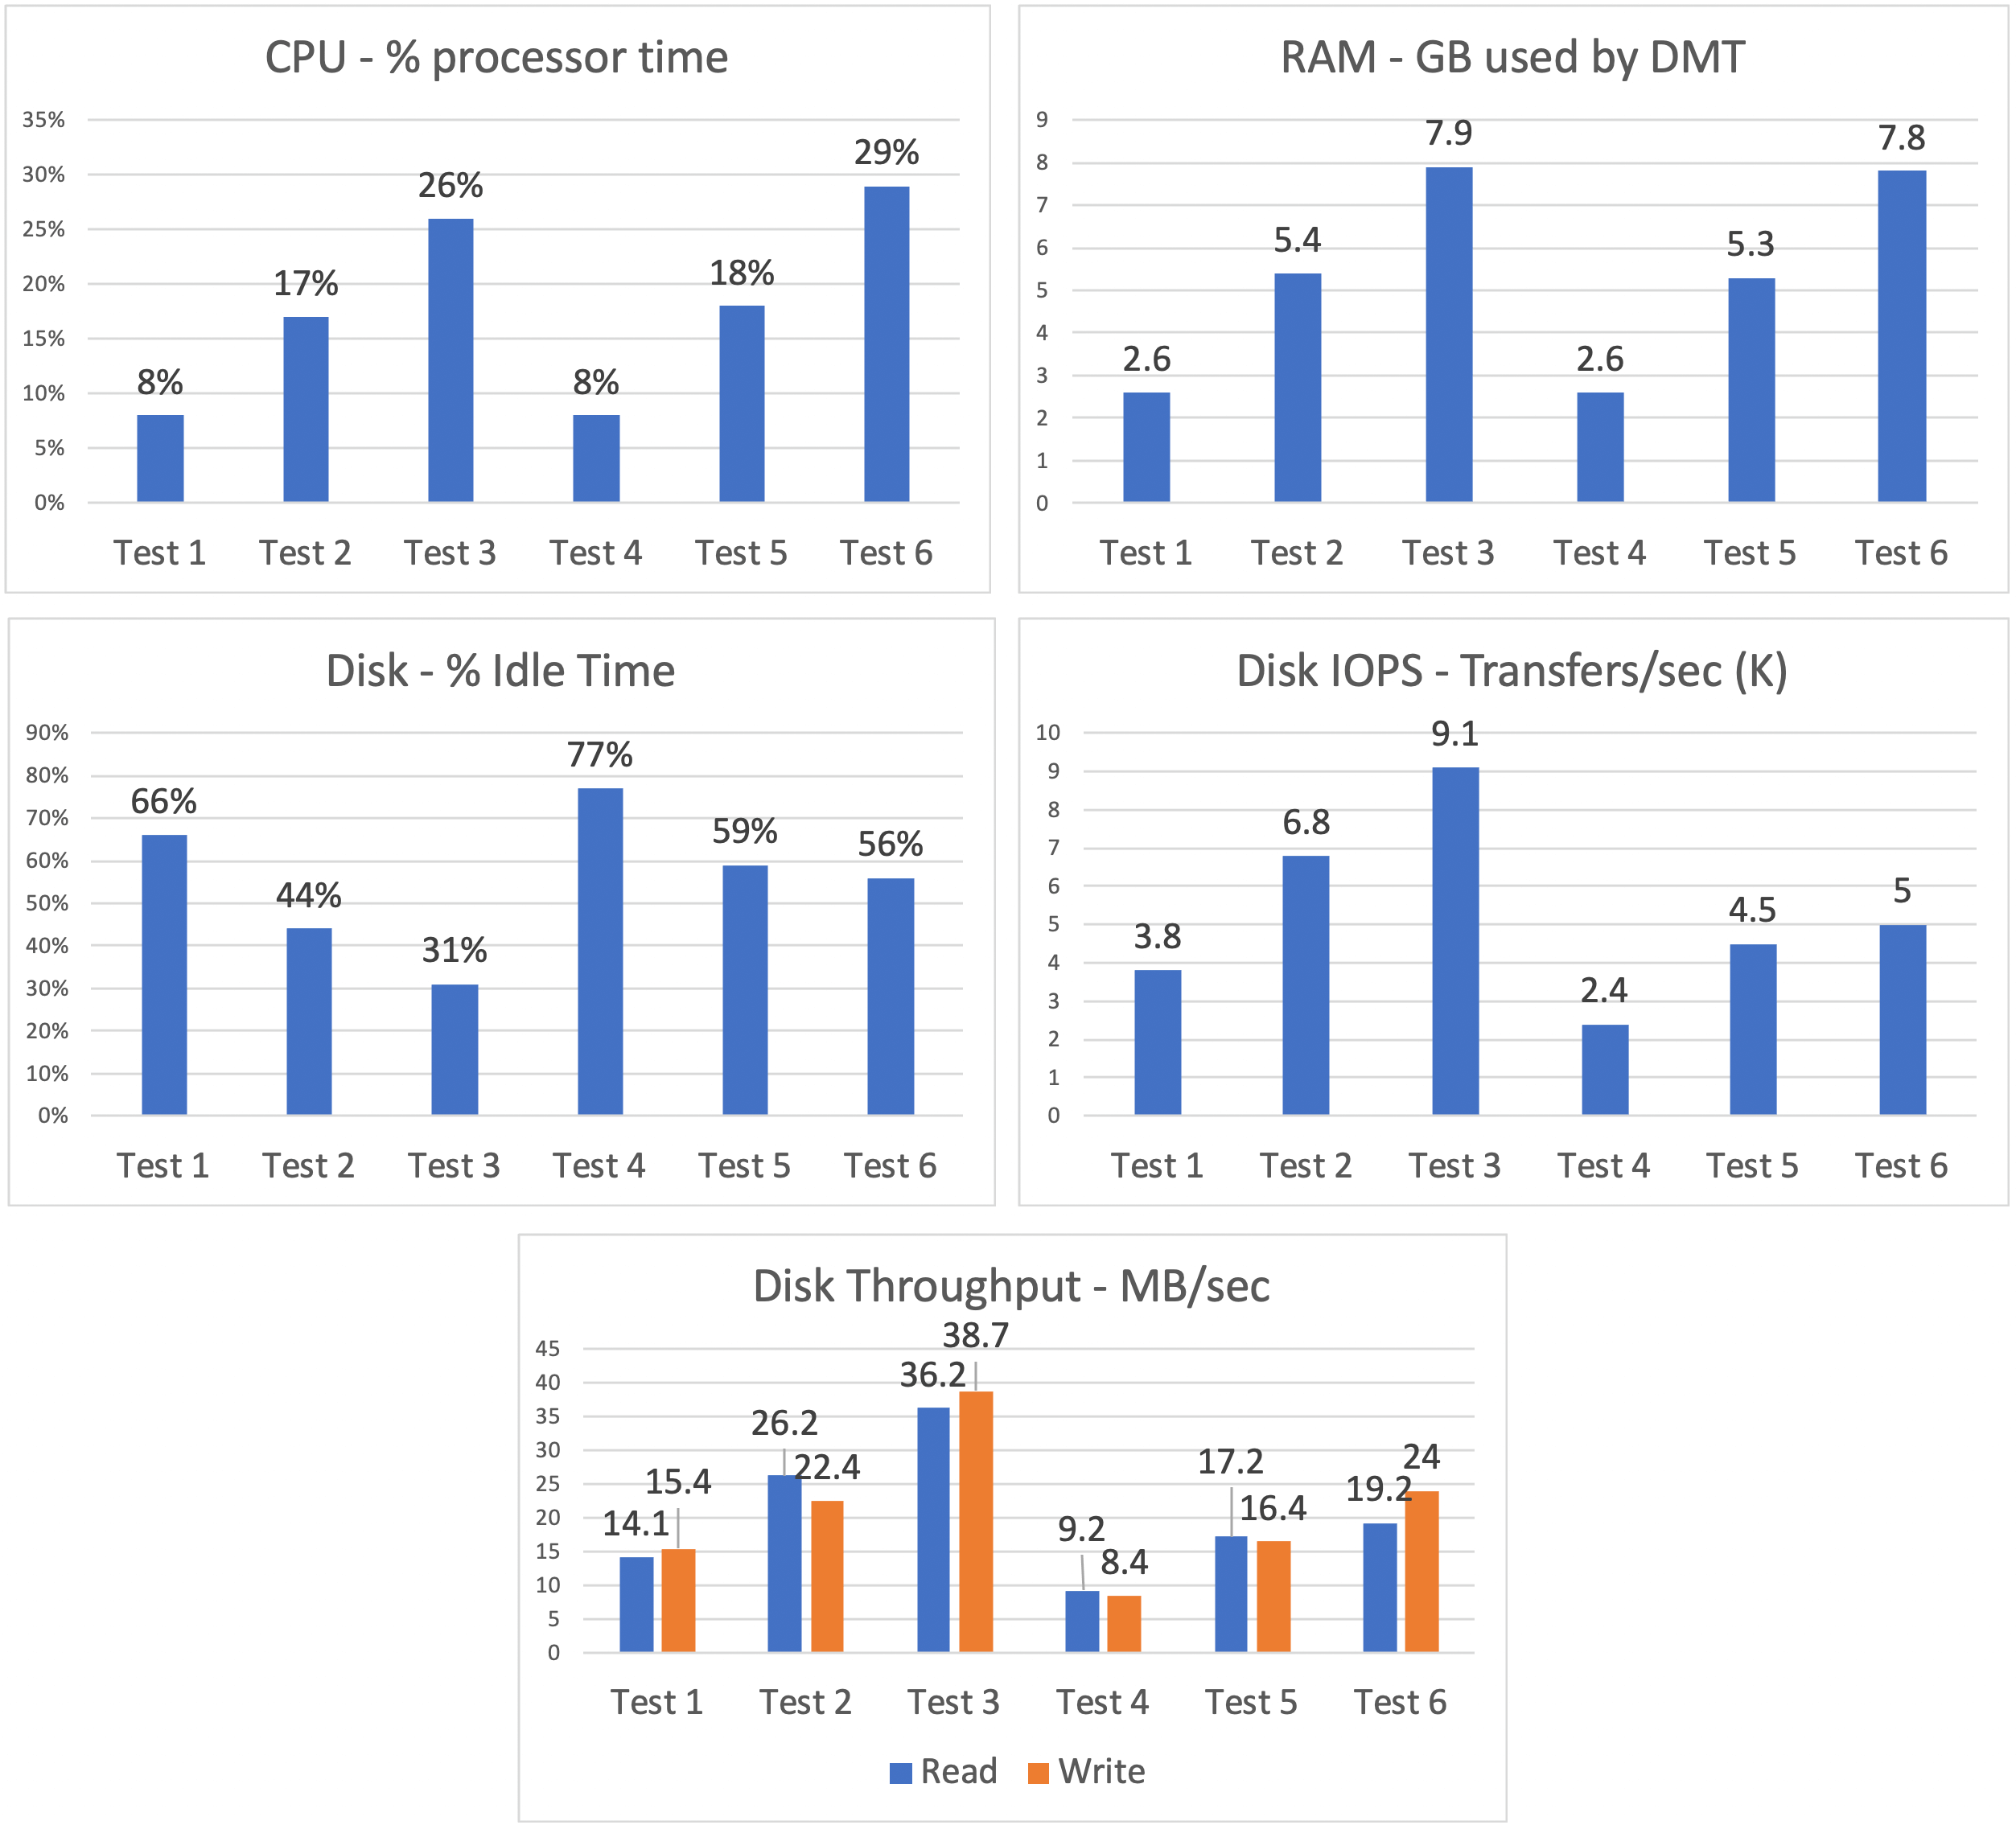
These charts show us that, as tables switch to record mode migration (tests 4-6), processor utilization slightly increases, and disk utilization decreases. In other words, the burden balance shifts slightly from disk to processor.
EBS Storage
Tests 1-6 were performed using very fast NVMe local storage. With AWS servers, this storage is physically attached to the host computer and is intended for temporary use – once the server is shut down, the content is lost. FileMaker servers hosted on AWS will use EBS storage. Our tests 7-8 used this type of storage; more specifically, General Purpose SSD (gp2). (Note: AWS EBS also has io1 which is more expensive than gp2 but provides better performance.) EBS gp2 also uses SSD drives, but these are slower drives as compared to the local NVMe drives, and they are subject to bursting limits – once the burst credits are used up, the drives revert to their slower baseline performance levels.
And indeed this is what we saw happen. The burst credits were exhausted about 20 minutes into test 7.
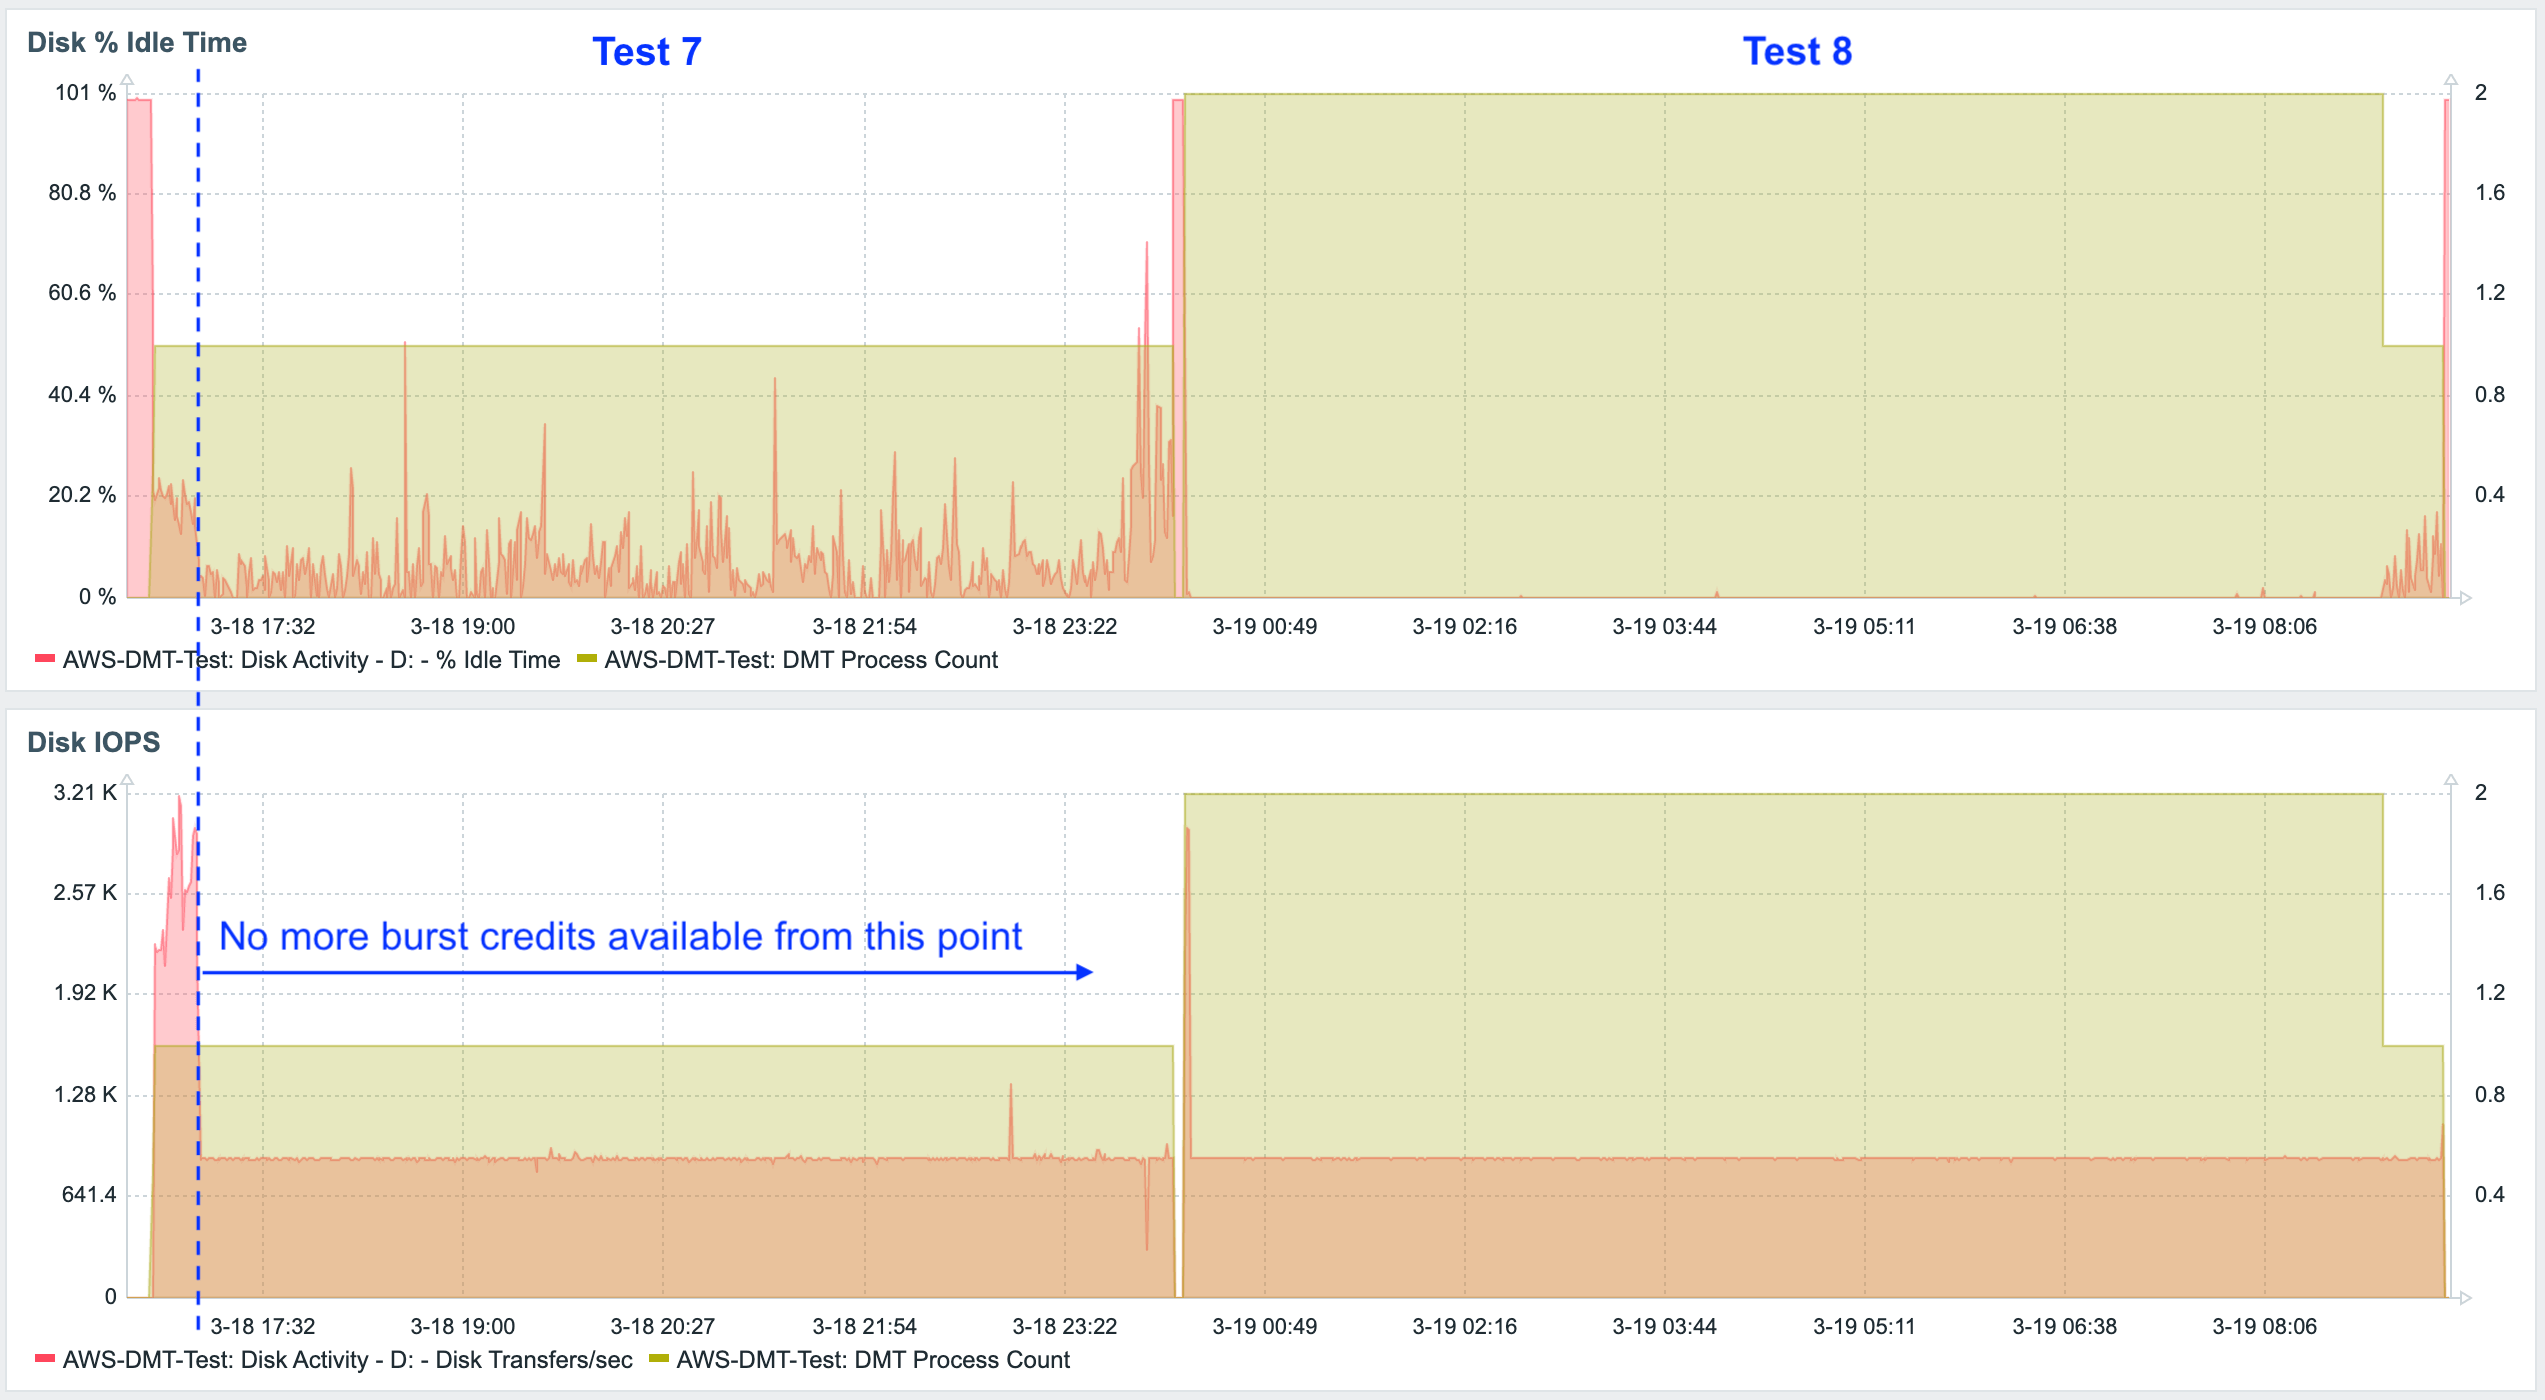
As a result, the migration took much, much longer to complete.
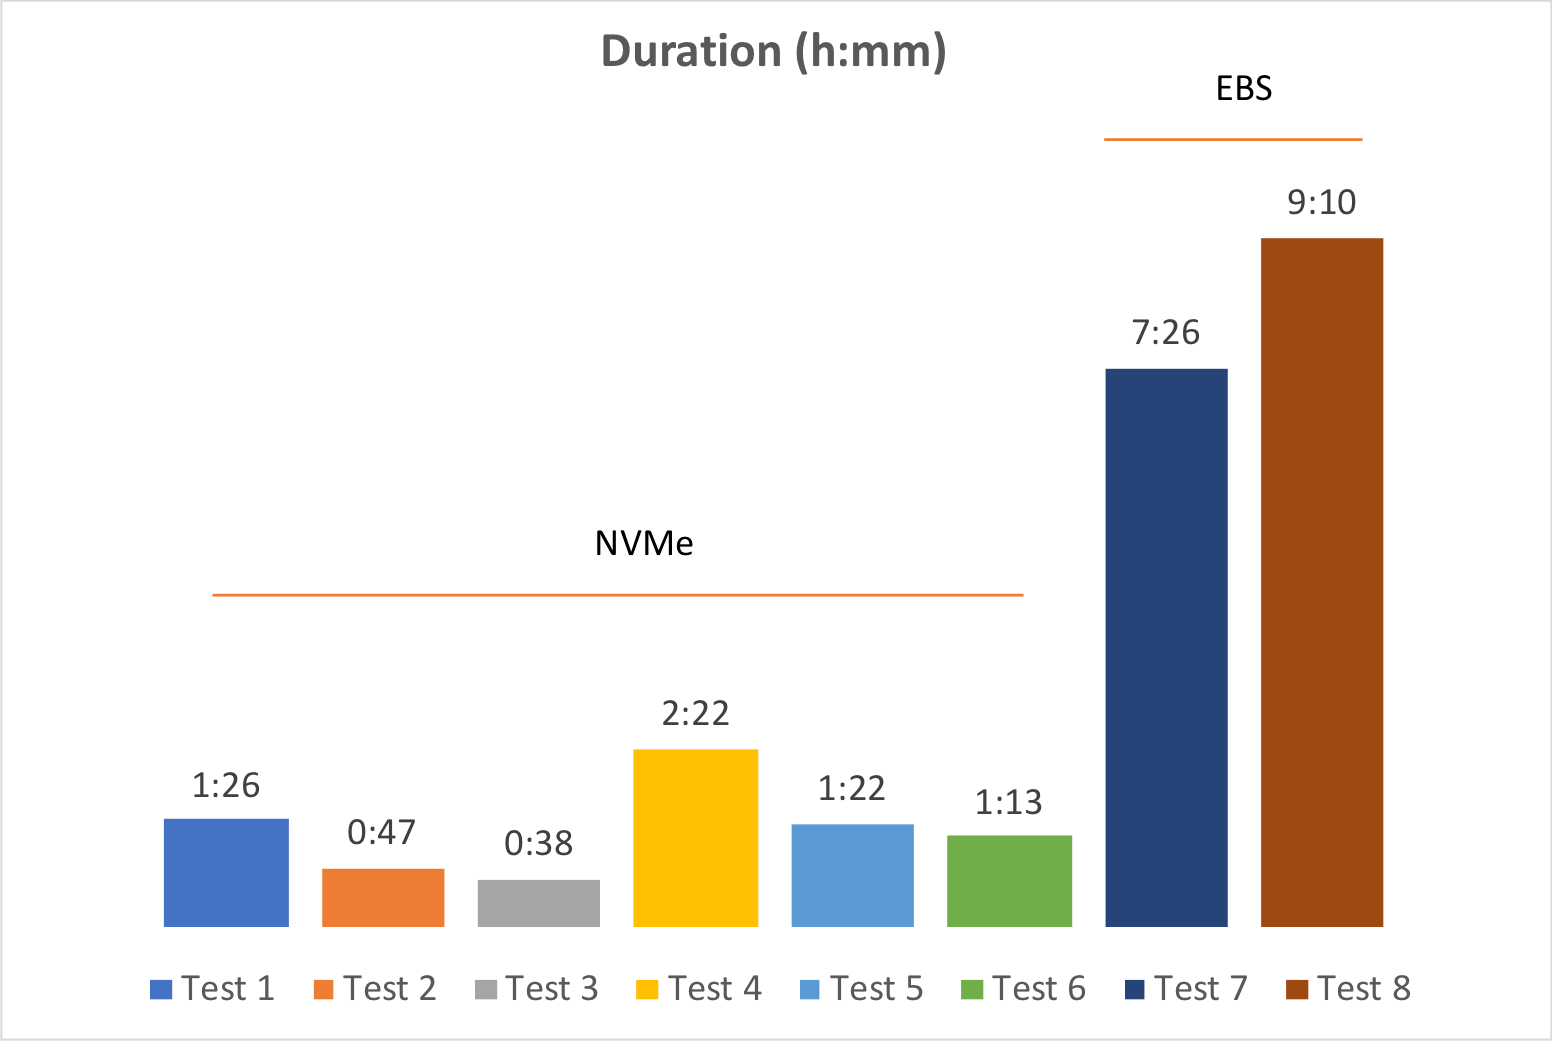
We didn’t bother running a ninth test (with three concurrent DMT processes), because it was clear that this was well outside of what was acceptable to our client. Fortunately, their production server is hosted on-premise, so their storage is not subject to burst credits.
Does this mean that FileMaker servers hosted on AWS are not well suited for DMT? Not at all. If your solution file size is small or if the nature of your business can accommodate longer outage periods, then there is no issue. If neither of those conditions is true, you still have several options. For example, you could shut down the server, change the instance to a type that supports local storage, copy the database files to the faster volume, run DMT, copy the files back, shut down the server again, and change back to the original instance type. Of course, this is a much more complicated procedure, but it will take much less time than running DMT on EBS, and it may still be preferable to other deployment models.
Conclusions
Our “worst case” test was completed in 1 hour and 13 minutes. We weren’t able to match our client’s storage specs exactly. Our test server used drives that were faster than our client’s production server, so if the same test was run there, it would run slower. At the same time, our worst-case test scenario was far more pessimistic than what we would encounter in a typical deployment. Those two factors offset each other, although it’s impossible to know exactly to what extent. Even so, we can conservatively expect that our migration would not take longer than 1 hour and 30 minutes to complete on our client’s production server. This was an acceptable time frame for our client.
Our testing shows that the bottleneck can depend on a number of factors. One of these is the number and size of the database files – both the overall total size and the relative file sizes. An even distribution of file sizes is preferred so that the largest file doesn’t become a bottleneck, which is what happened in our case.
The speed and availability of hardware resources are also critical. DMT seems to allocate about 2.5-3.0 GB of RAM per process. This stays pretty consistent regardless of the size of the file being migrated. If we were to run four DMT processes concurrently, but we only had 8 GB RAM available, memory would become our bottleneck. Similarly, if CPU or storage is underpowered, they could become the constraining resource as more concurrent DMT processes are spun up.
A third takeaway is that each situation will have its own optimal number of concurrent processes. In our cases, running the migration with three processes was 11% faster than if we had used two processes. And three processes were an impressive 49% faster as compared to using just one process. But if we had used four concurrent processes, our migration may very well have run more slowly.
What’s Next
This blog post examined a range of considerations that need to be made when changing the FileMaker solution deployment model to take advantage of the Data Migration Tool.
In part 2, we discuss how concurrent DMT processes can be launched in a simple and secure way, without needing to manually type out the DMT command multiple times and without relying on batch files that store full access passwords inside of them.
Are you interested in transitioning to a release-based deployment model that takes full advantage of the Data Migration Tool? Reach out to us – we’ll be happy to help.
Excellent write-up, Mislav! I appreciate the effort you guys put into testing ‘best-case/worse-case’ as I was dealing with a recent migration on a system that had a ton of development changes over the course of the year. Usually imports with the DMT take <30 minutes but this last release took in excess of 5 hours to complete. At least now I can look at a table of likely culprits to what causes something to revert to record mode vs. block mode.
Cheers!
Thanks James. For sure, the fact that migrations of a set of solution files can take different amounts of time (depending on what dev changes were made) makes them tricky to plan for.